User manual
Personal report
The personal report offers thorough details on a candidate's performance and activity during a test. It includes information about the score, questions, time taken, earned certificates, and more.
Below, you'll find explanations for each tab in the personal report.
-
Page layout
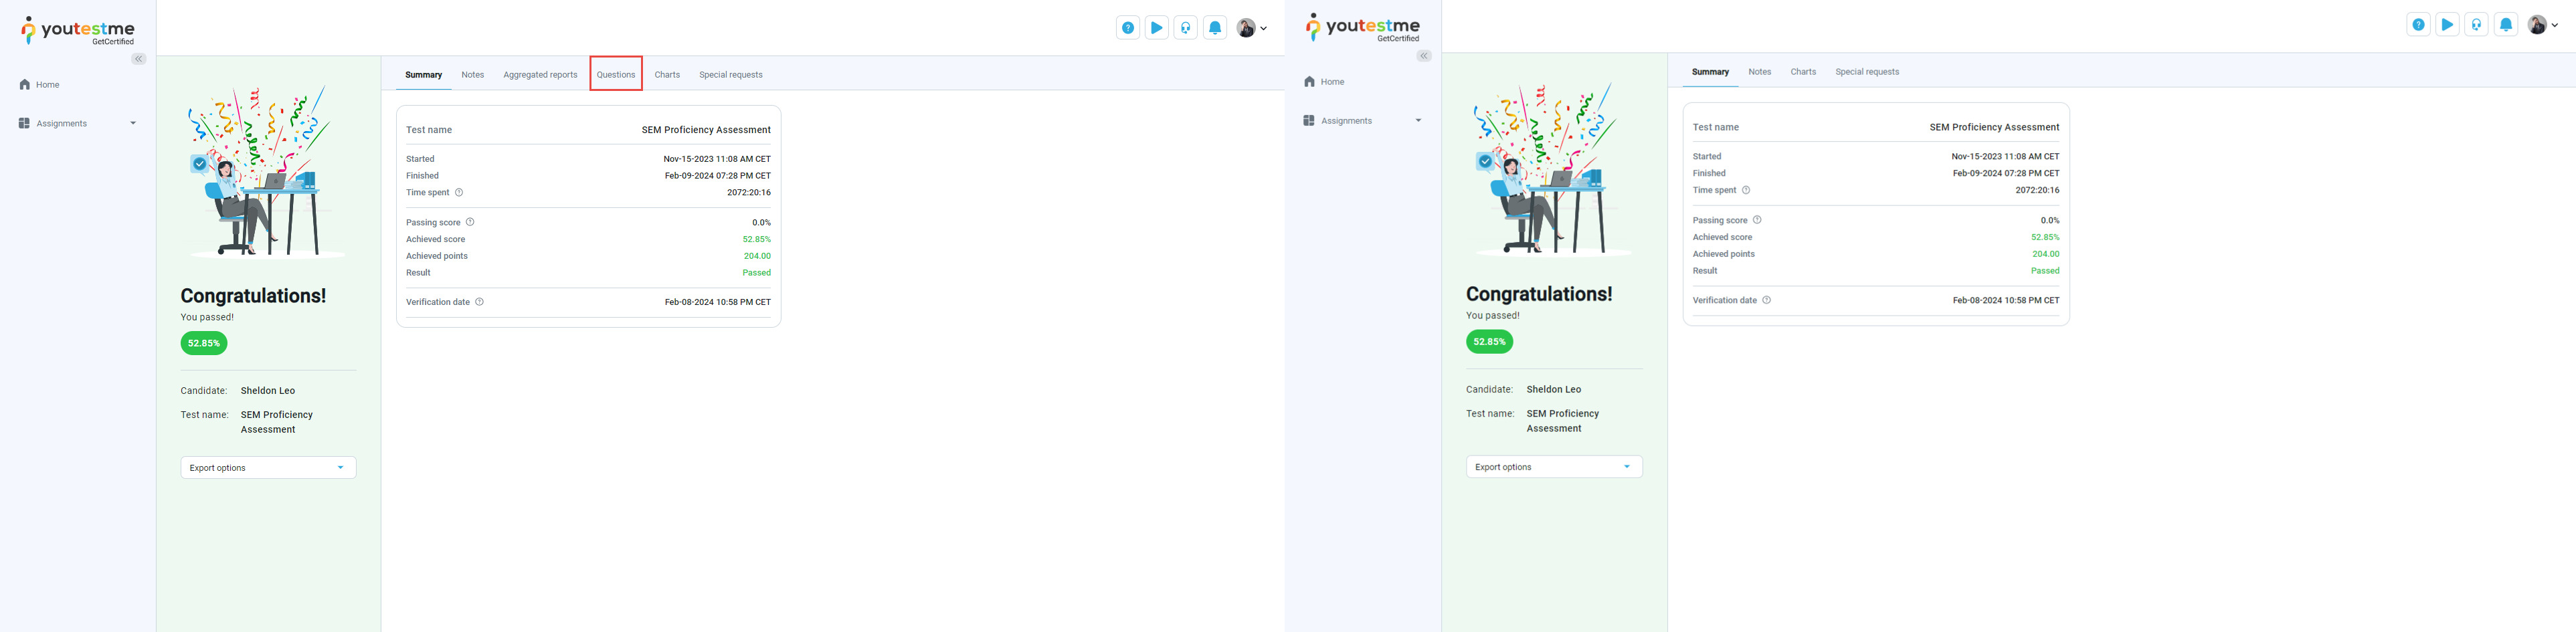
Depending on the settings, students can preview it in two ways:
-
You can see the test questions along with whether you answered them correctly or not and any notes if they were allowed during the test. (It depends on the test settings).
-
Alternatively, you can view only your test score without going into the specifics of each question. (It depends on the test settings).
Summary page
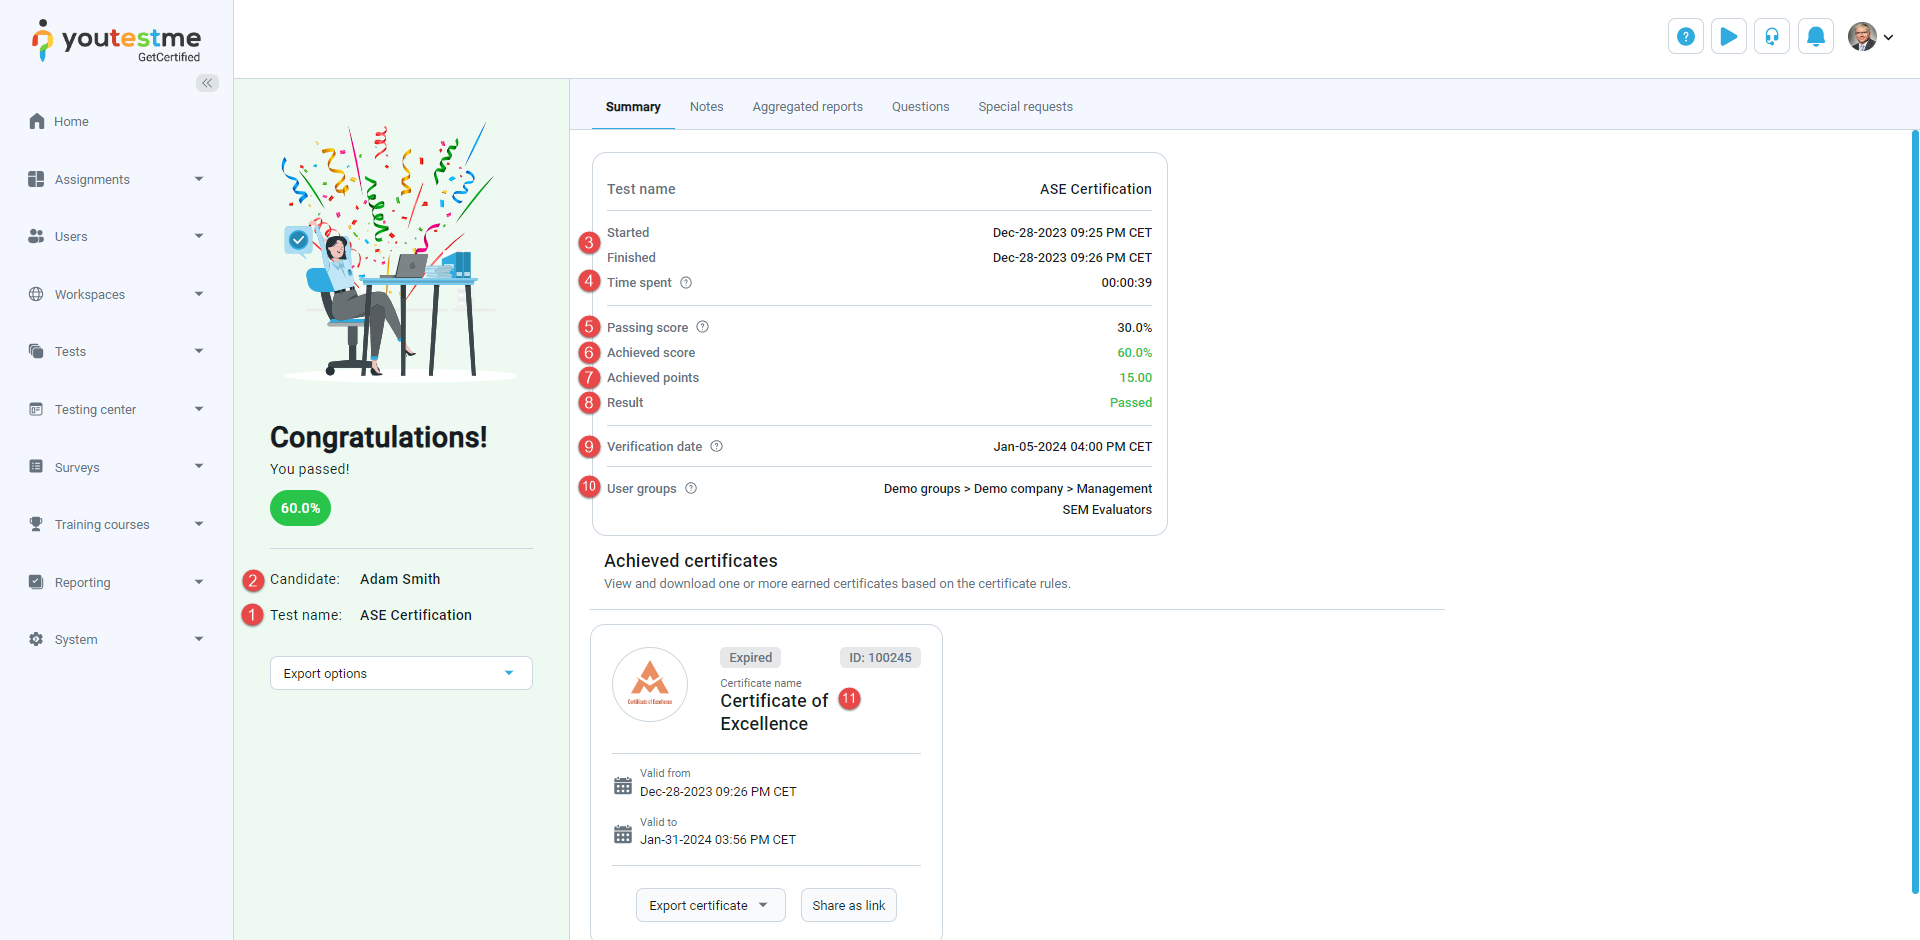
The summary page is the main section of the report, offering an overview of essential information regarding the test and the candidate's results:
-
Test name - The name of the test that the user has completed.
-
Candidate - The name of the candidate who took the test.
-
Started/Finished - The time when the user started and completed the test.
-
Time spent - The total time taken to complete the test including any pauses or interruptions that may have occurred during test attempt.
-
Passing score - The percentage that must be achieved to pass the test. Depending on the test settings, this passing score may or may not be inclusive. If the passing mark is inclusive, candidates will pass the test if they gain a score equal to or higher than the passing mark. You can check whether the passing score is inclusive or not in the tooltip next to the label name.
-
Achieved score - The percentage achieved by the candidate.
-
Achieved points - The total points earned by the candidate.
-
Result - Indication of whether the candidate passed or failed the test.
-
Verification date - The date when the test attempt has been verified. Once verified, changing the grading setting will not affect the candidate's score.
-
User groups - Names of user groups to which the user belongs. If there are no user group names listed, it means the candidate is not a member of any user group. If a user is a member of a subgroup, the complete path to the subgroup will be shown.
-
Achieved certificates - Displays the certificates that the candidate has earned.
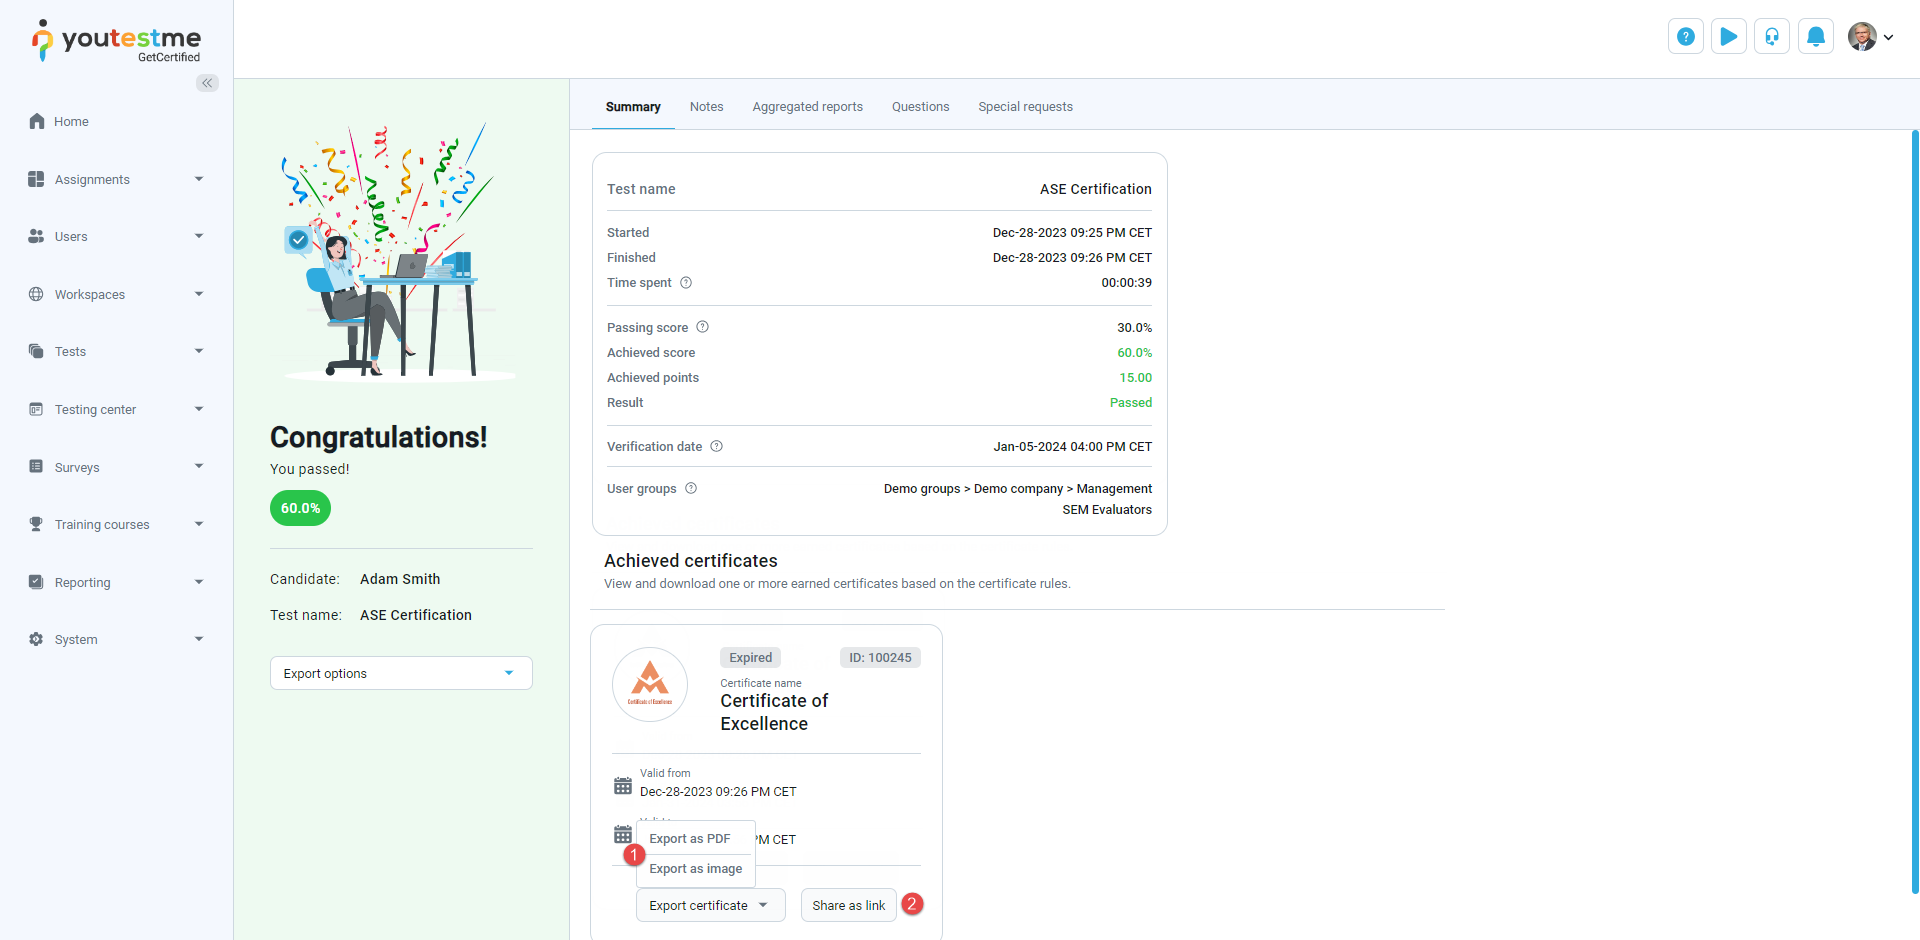
Additionally, the options that can be performed on this page include:
-
Export certificate as PDF or image.
-
Share the certificate as a link.
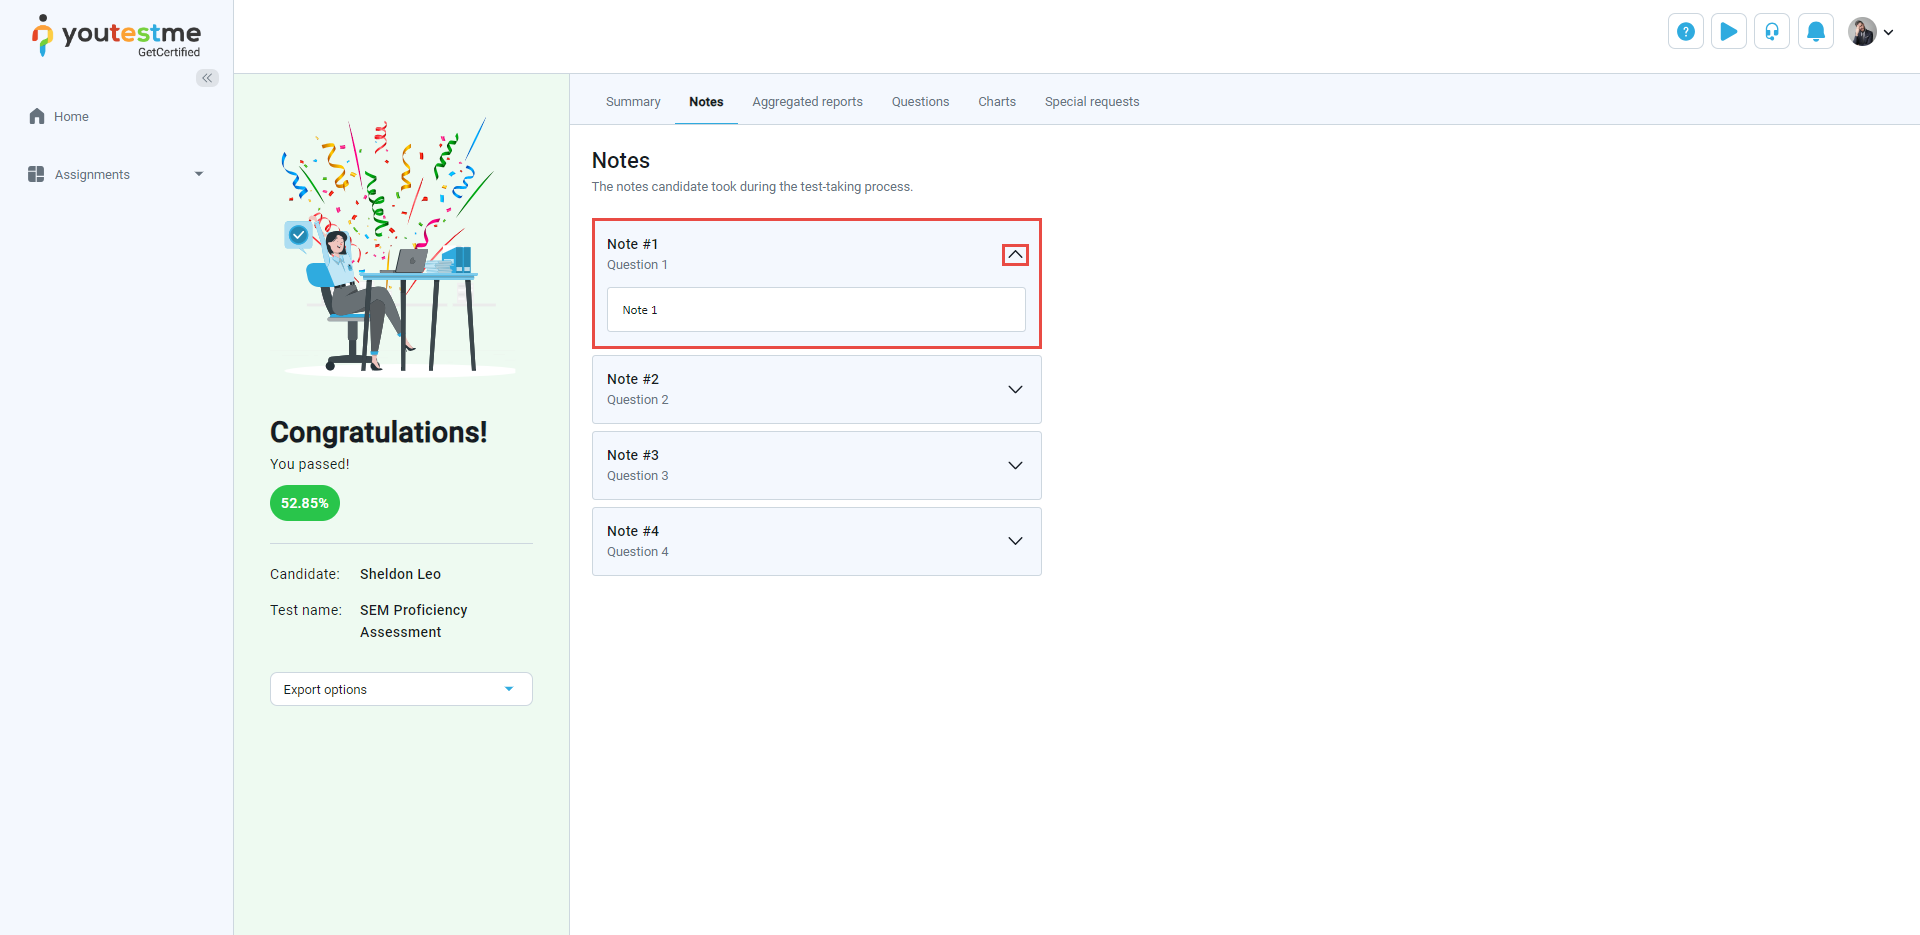
Notes
In this tab, you can review all notes created by you. To preview a note, click the arrow icon.
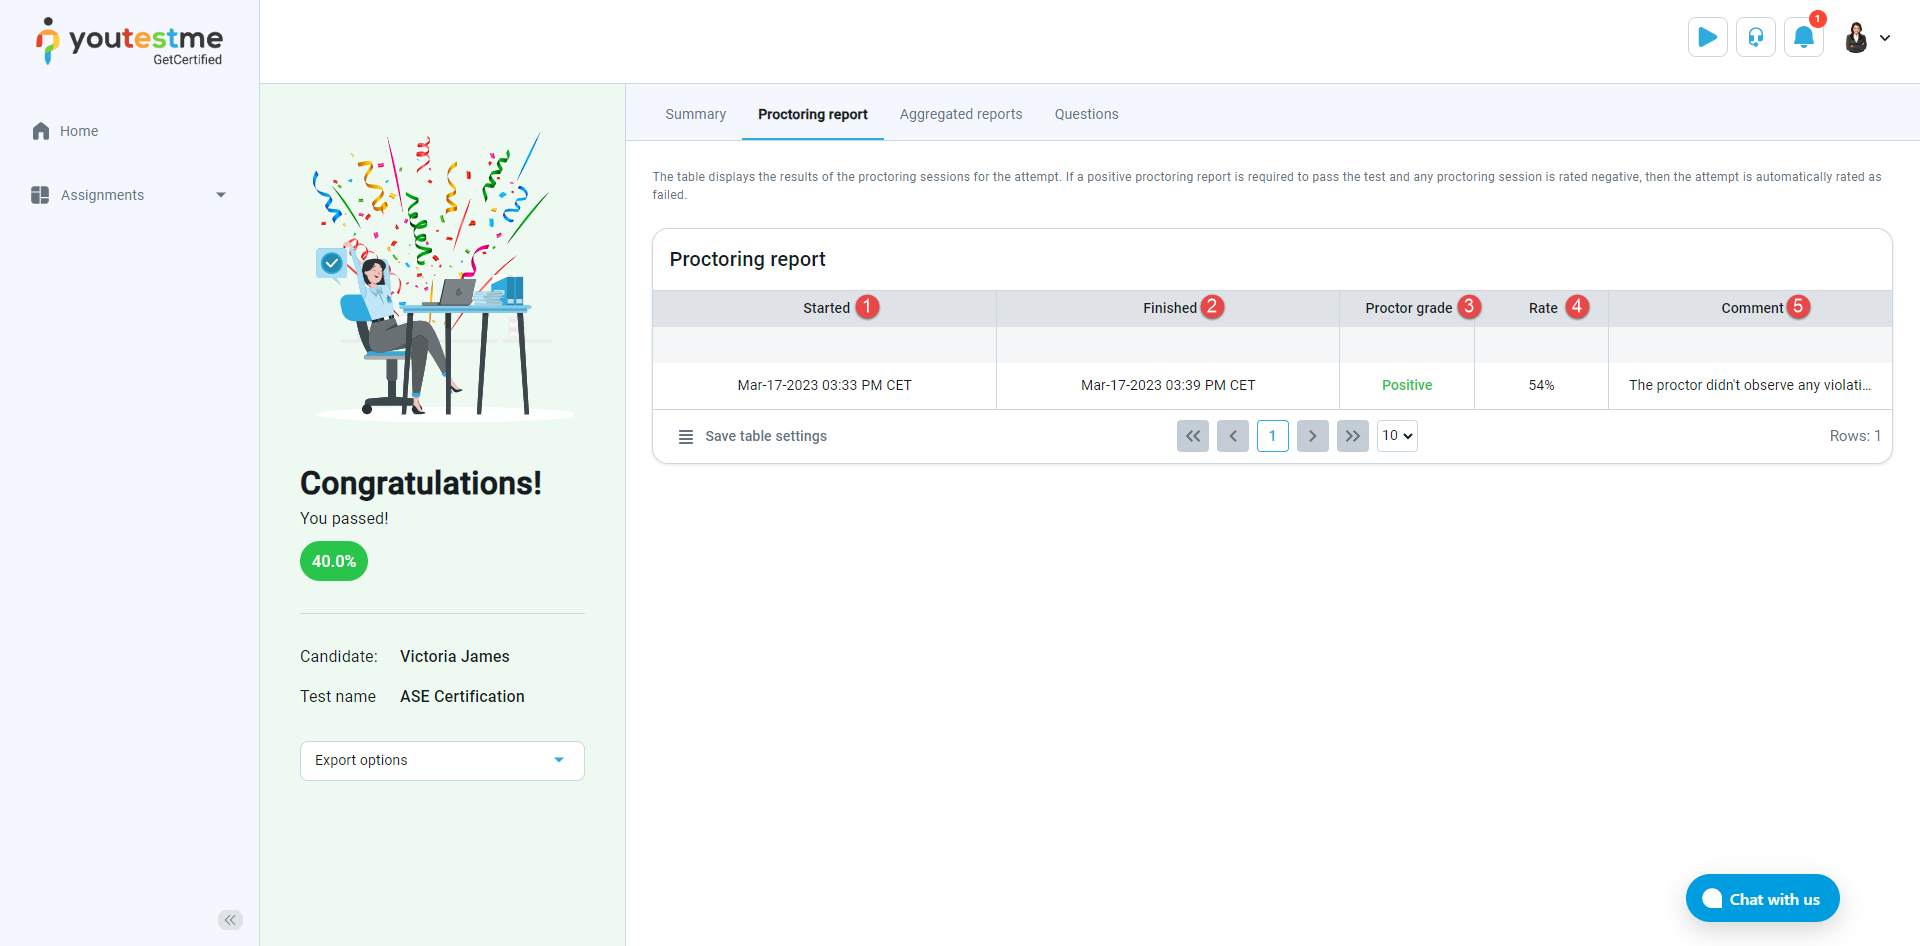
Proctoring report
The table displays the results of the proctoring sessions for the attempt. If a positive proctoring report is required to pass the test and any proctoring session is rated negative, then the attempt is automatically rated as failed.
In the table are presented the following information:
-
The time when the user started the test.
-
The time when the user finished the test.
-
If the proctor grades the report, the proctoring grade will be displayed. It can be one of the following: Neutral, Positive, or Negative.
-
Proctoring rate - represents the percentage of correct behavior or compliance exhibited by the candidate during the test-taking process. In this context, a higher rate indicates that the candidate had fewer violations or incidents flagged by the AI proctoring system, demonstrating a higher level of compliance and integrity during the test.
-
The comment from the proctor will be displayed if the proctor has entered it.
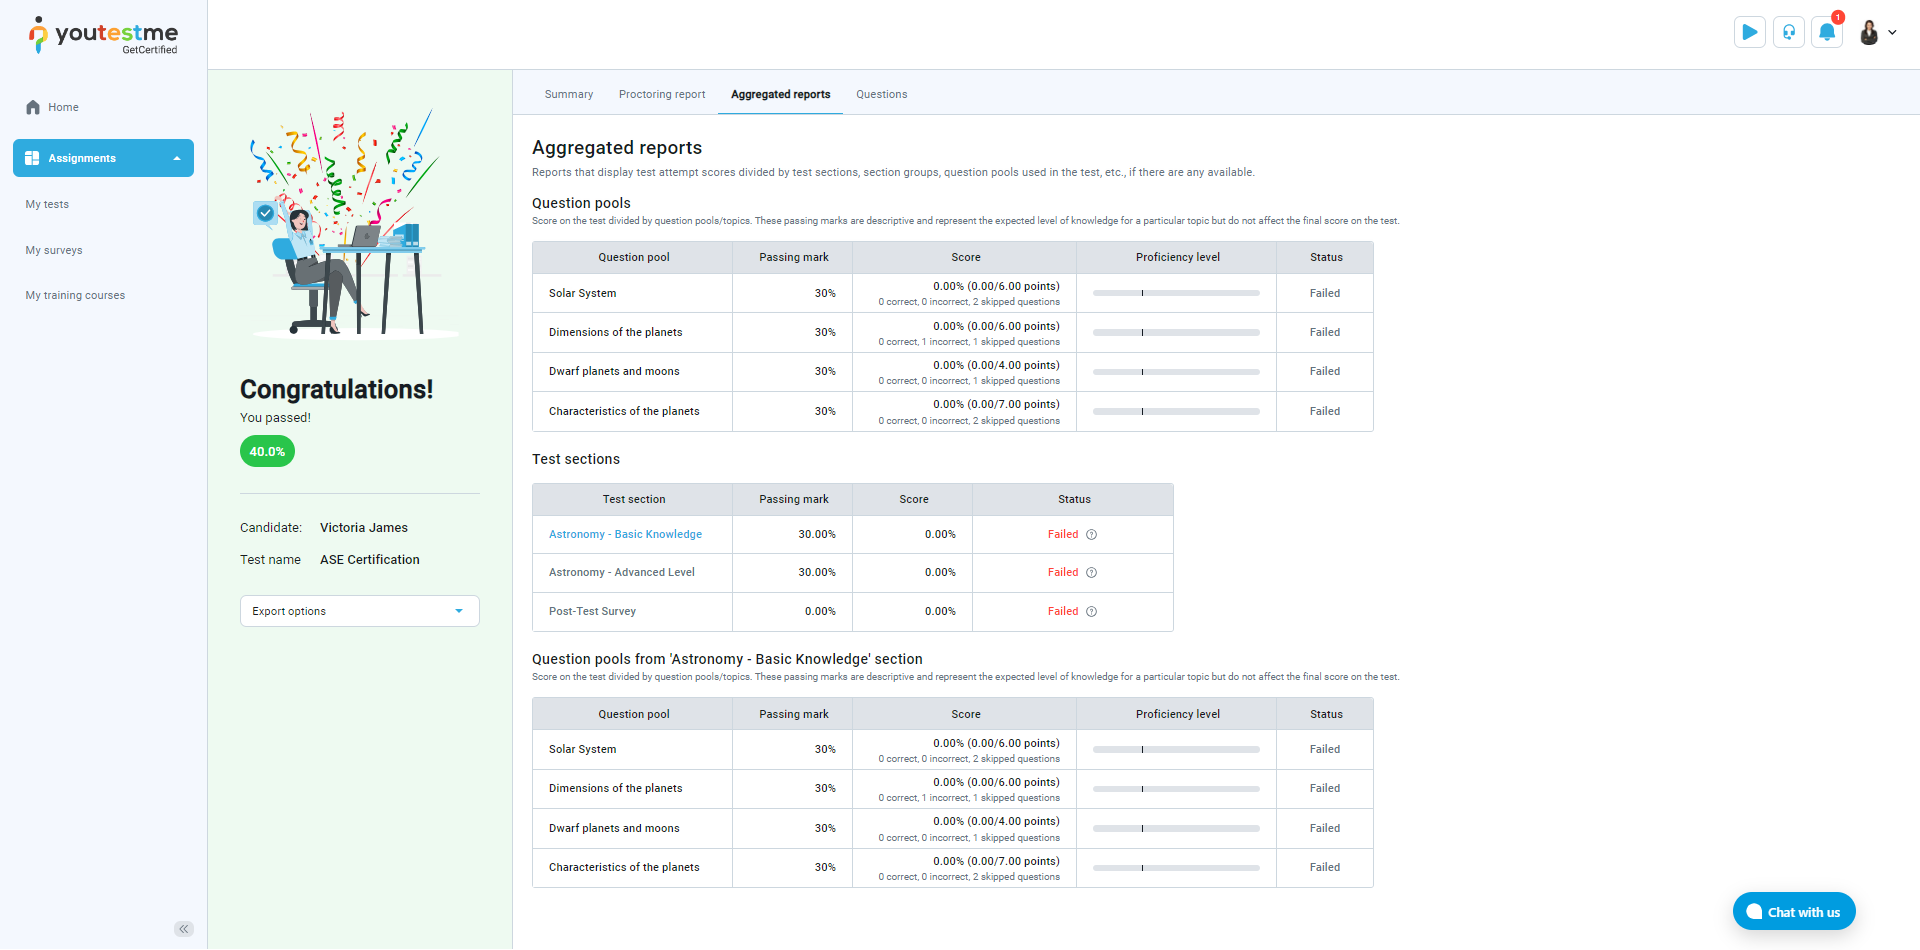
Aggregated reports
Aggregated reports are classified into overall test statistics and statistics at the test section level (if the test contains sections). These reports provide a breakdown of test attempt scores based on various factors such as test sections, section groups, and question pools used in the test. These reports offer insights into how candidates performed in different aspects of the test. They may also include additional details depending on their availability, allowing for a more comprehensive test results analysis.
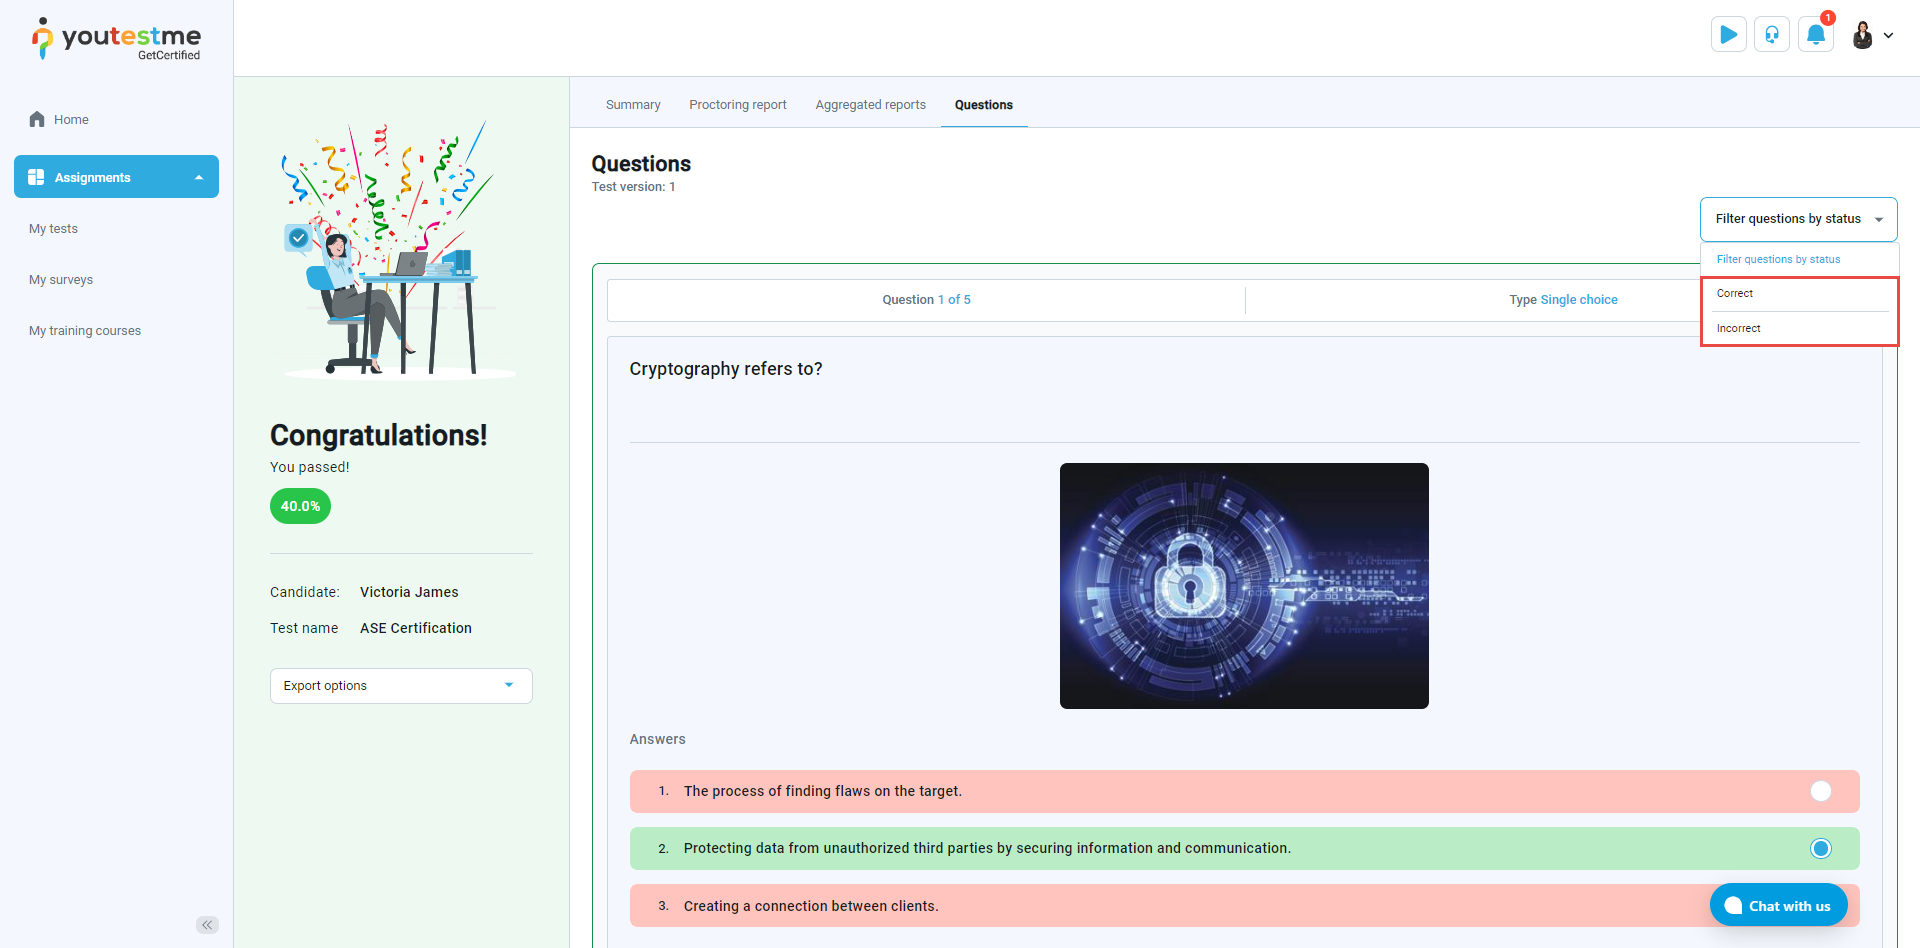
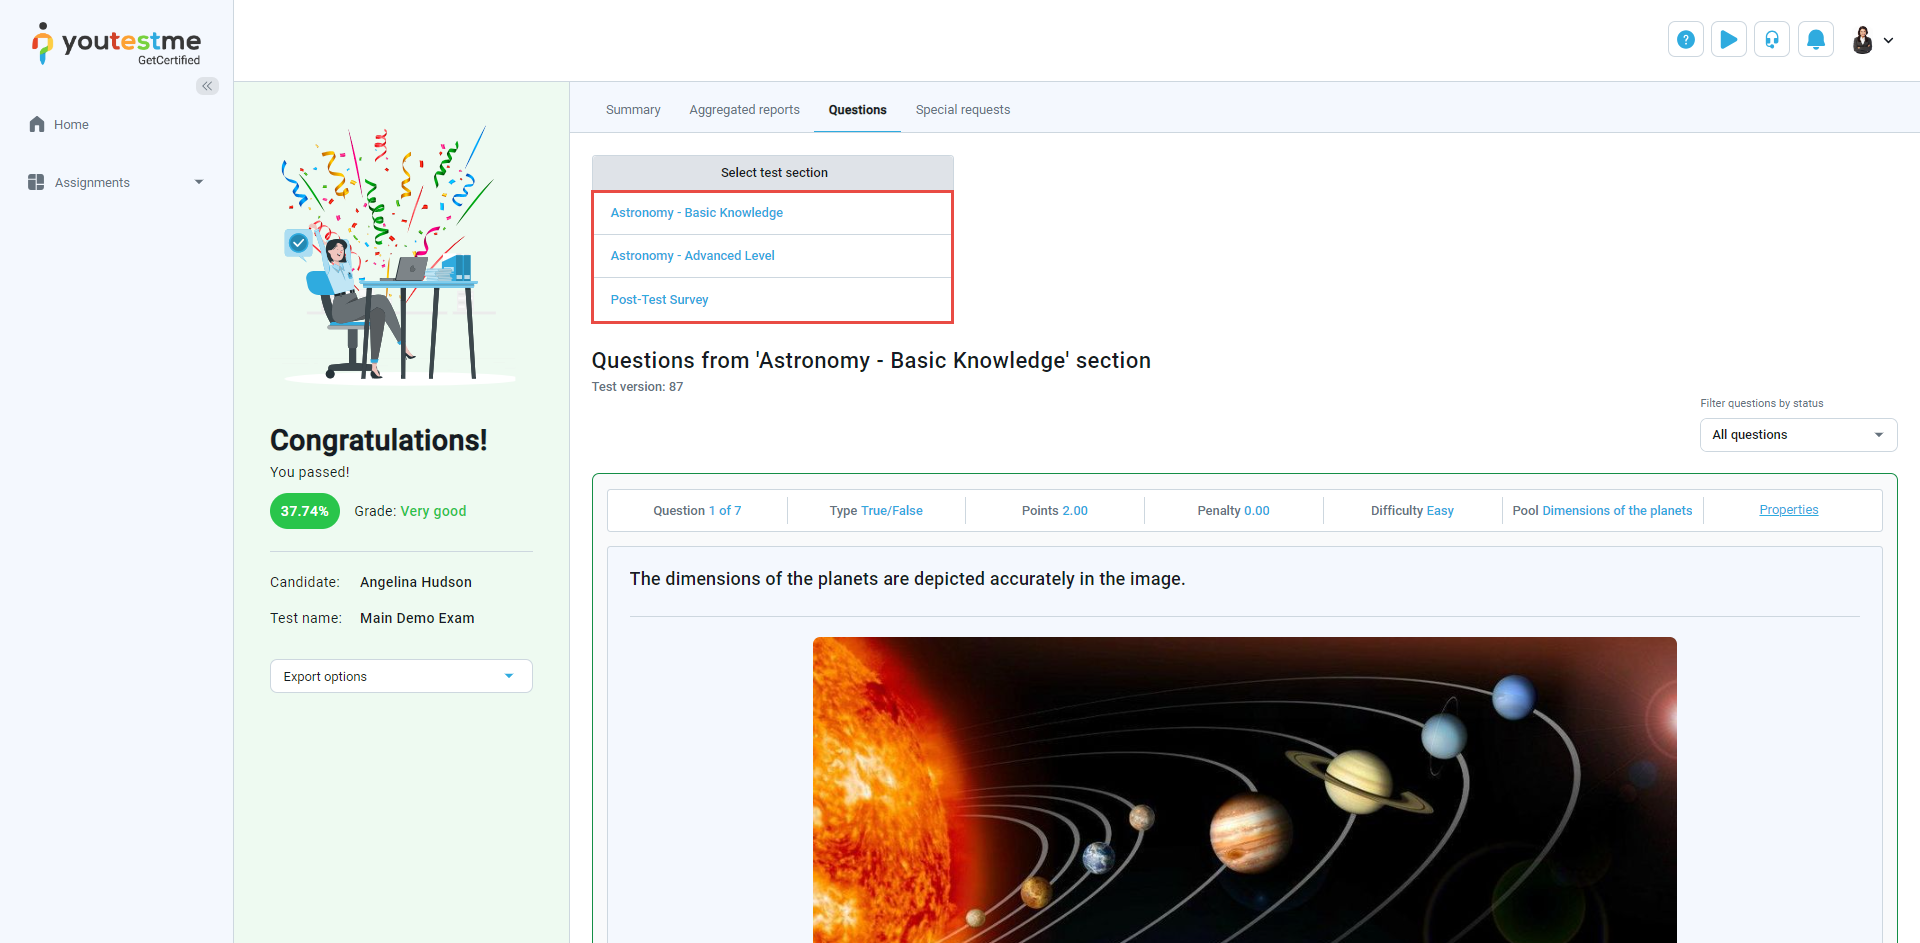
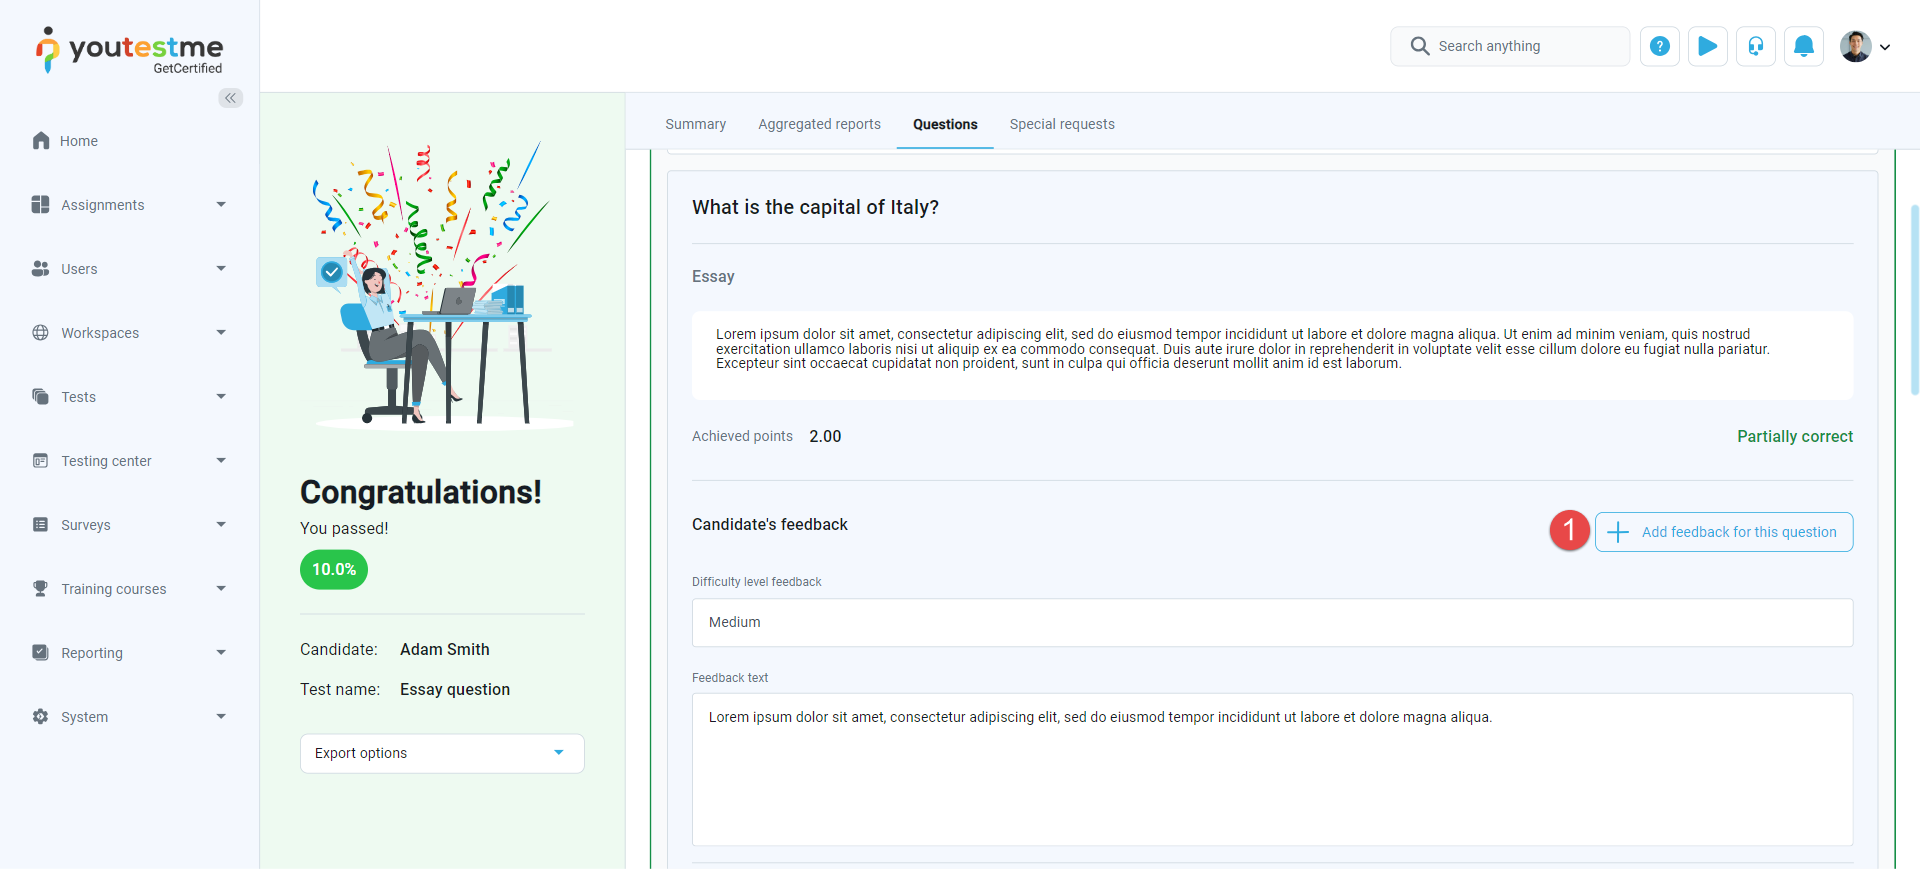
Questions
In the Questions tab, users are presented with the test questions and their correct answers. Users can filter the questions, displaying only those with the correct or incorrect answers.
If the test has sections, you'll see a list of all sections. Click on a section name to open the questions for that specific section.
If "Enable candidates' feedback on questions" option is enabled for the test, candidates can add their feedback for each of the questions by clicking on the "Add feedback for this question" button. Added feedbacks can be modified by repeating this process.
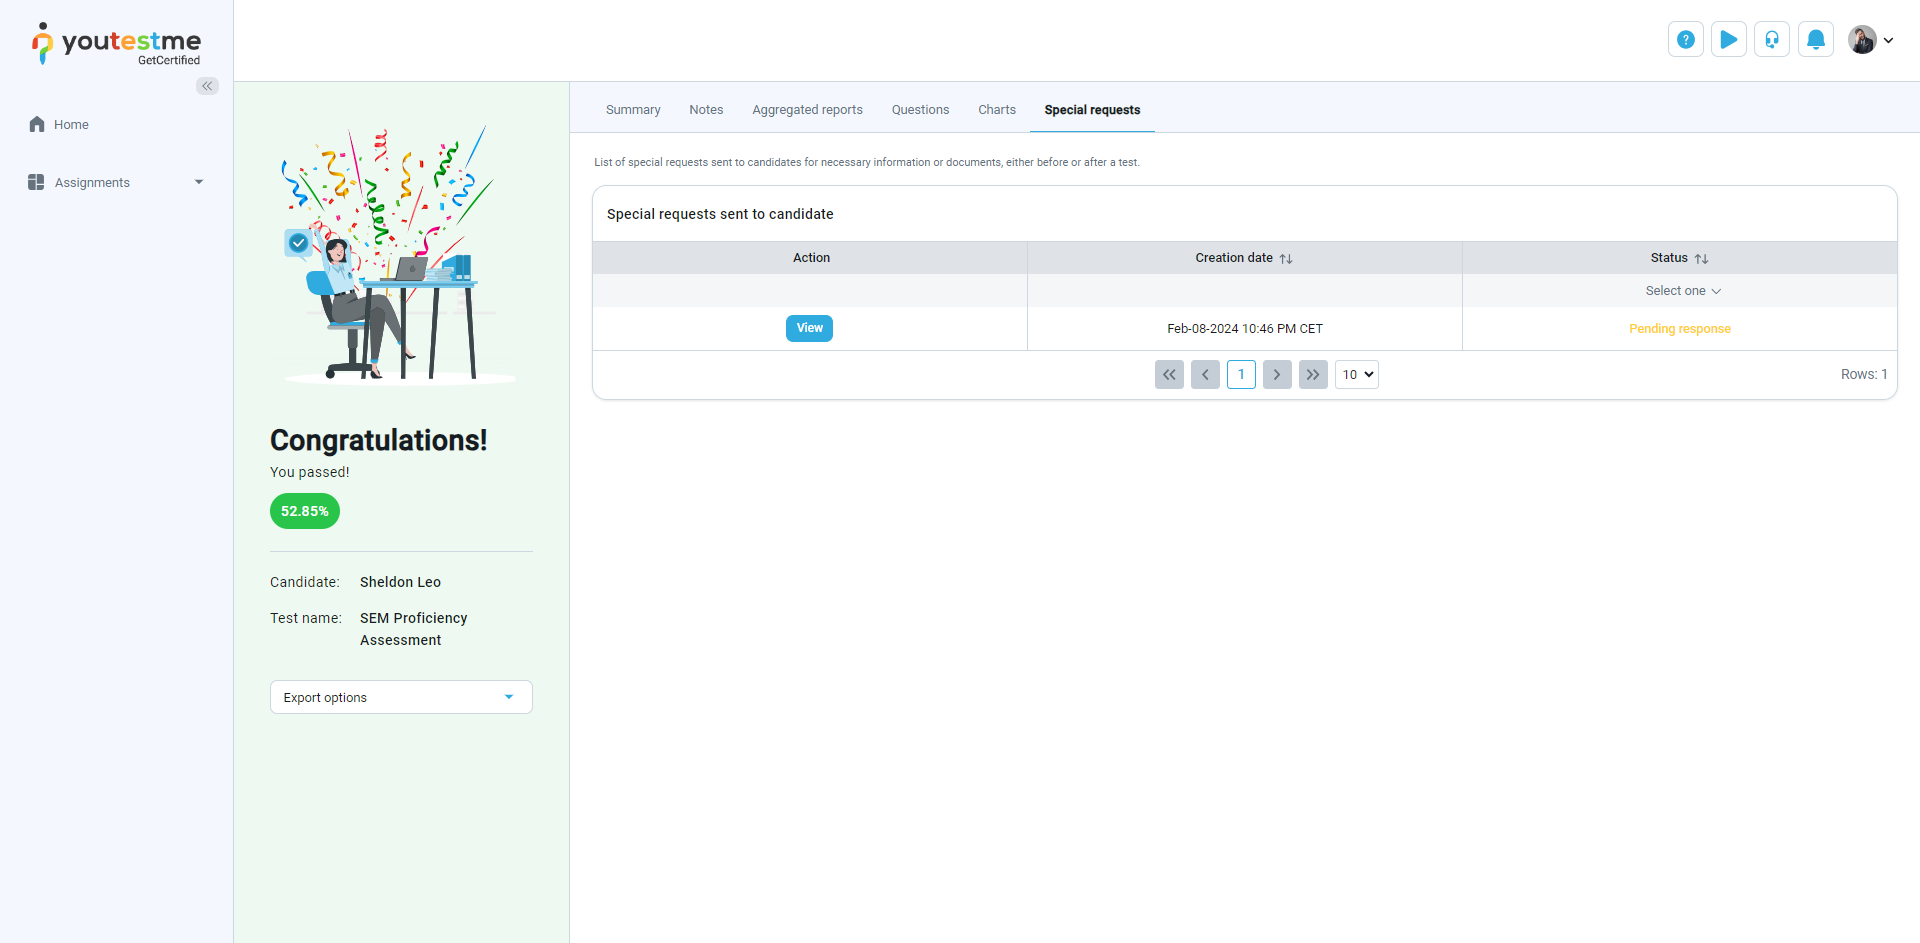
Special requests
Special requests are used to request information or documentation from candidates, either before or after a test. For instance, if a candidate needs to provide an ID before a test, and it's found invalid, the instructor can send a special request for a valid ID to avoid canceling the test attempt.
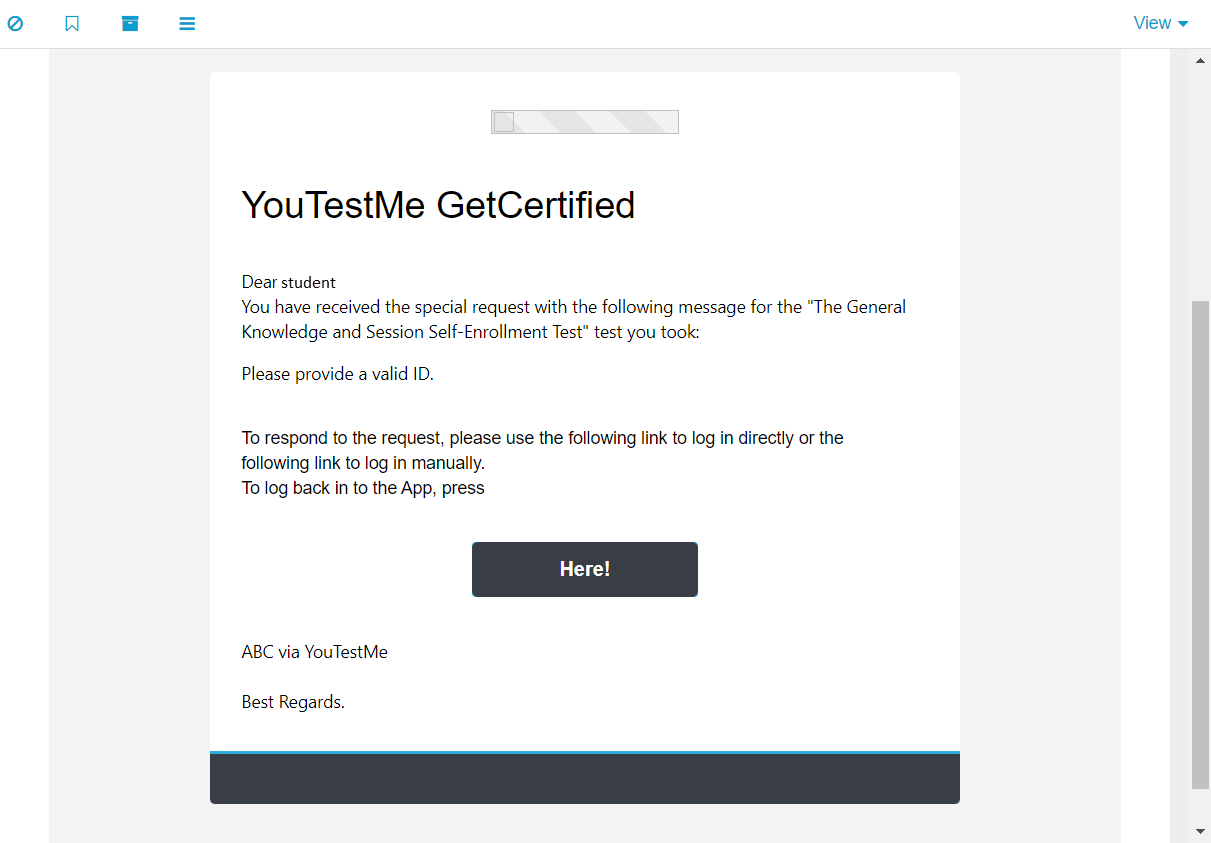
The student will be sent an email containing the special request link.
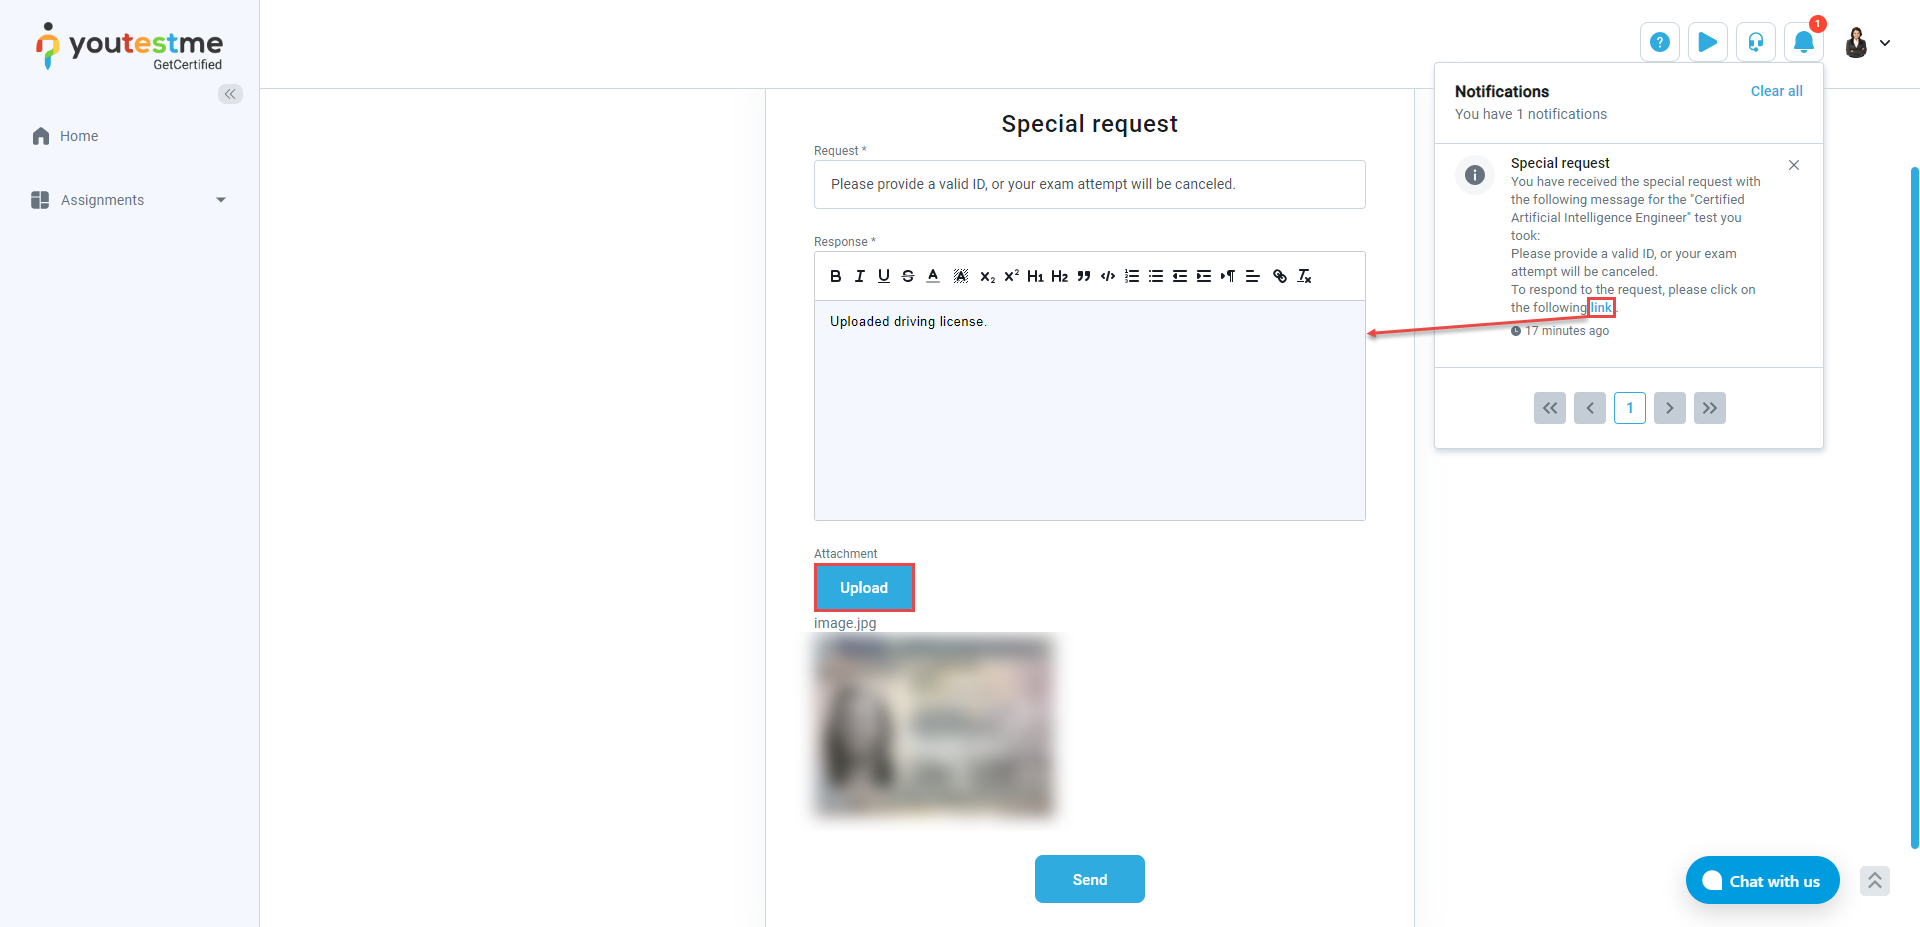
The candidate can also access the special request dialog through the link from the in-app notification. Clicking on it, the candidate will be presented with a dialog where they can enter their response and upload an attachment if needed.
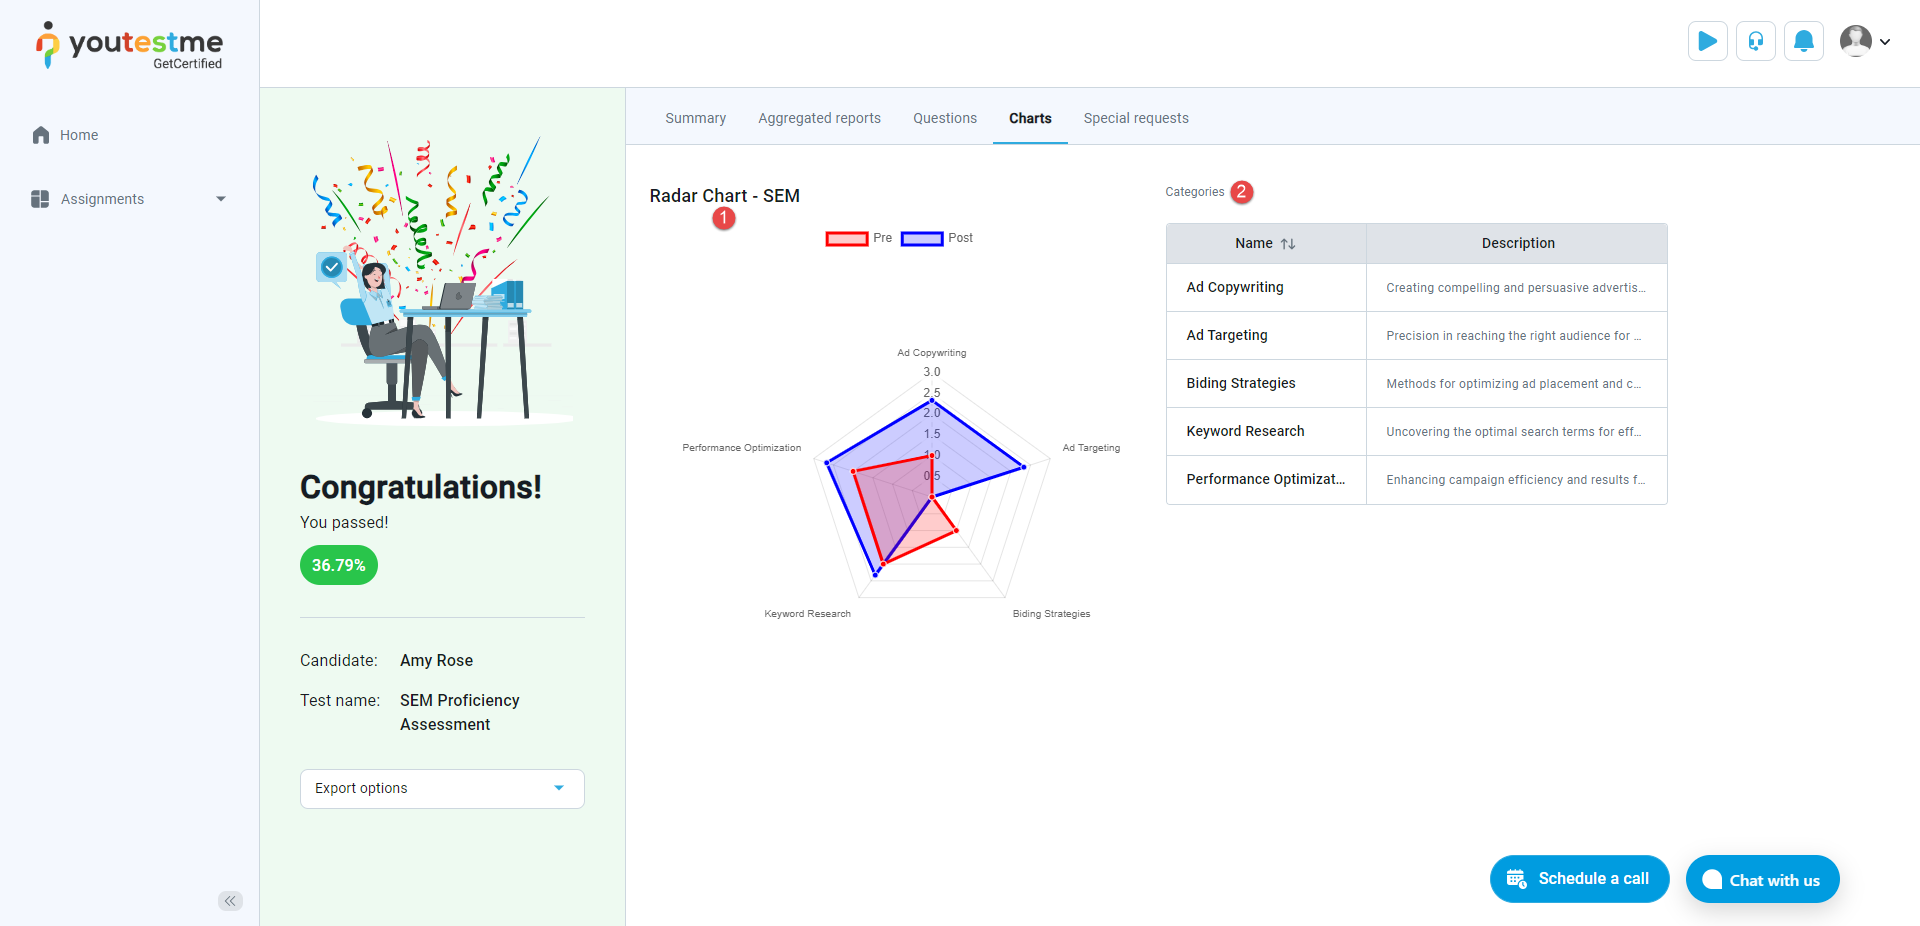
Charts
This tab features a chart displaying summarized or average points scored by question categories assigned to each question. This tab is only visible if a chart is created for the test.
The candidates can see the following information on this page:
-
Chart name - Name of the generated chart.
-
Chart categories - The table displays a comprehensive list of all chart categories and their respective names and descriptions. These categories are directly associated with the questions and illustrate the candidates' progress on the chart, providing insight into their performance.
Survey personal reports
Summary
-
Survey name - This tells you the name of the test the user took.
-
Started/Finished - These are the times the user began and completed the test, so you know how long it took.
-
Time spent - This shows you the total time the user spent on the test, indicating their level of engagement.
-
User groups - This section will tell you if the user belongs to any specific groups. It helps categorize users based on certain criteria.
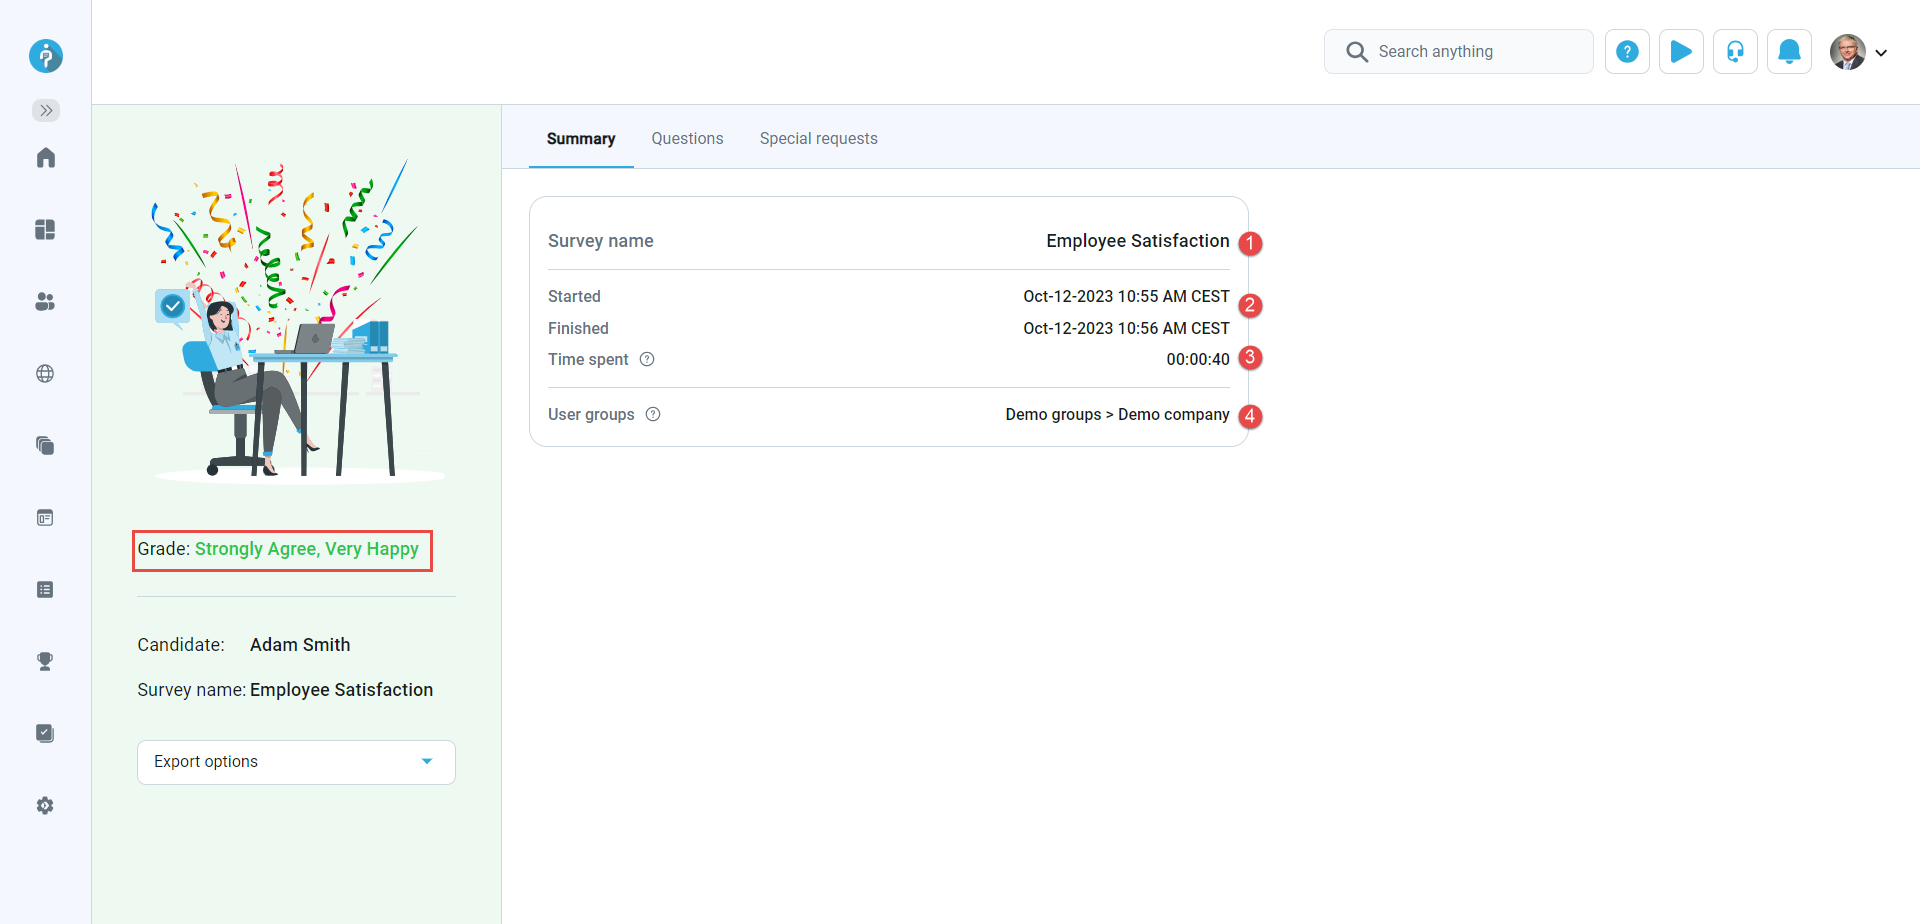
The summary page is the first part of the report, and it gives you a quick overview of the test and how the candidate did:
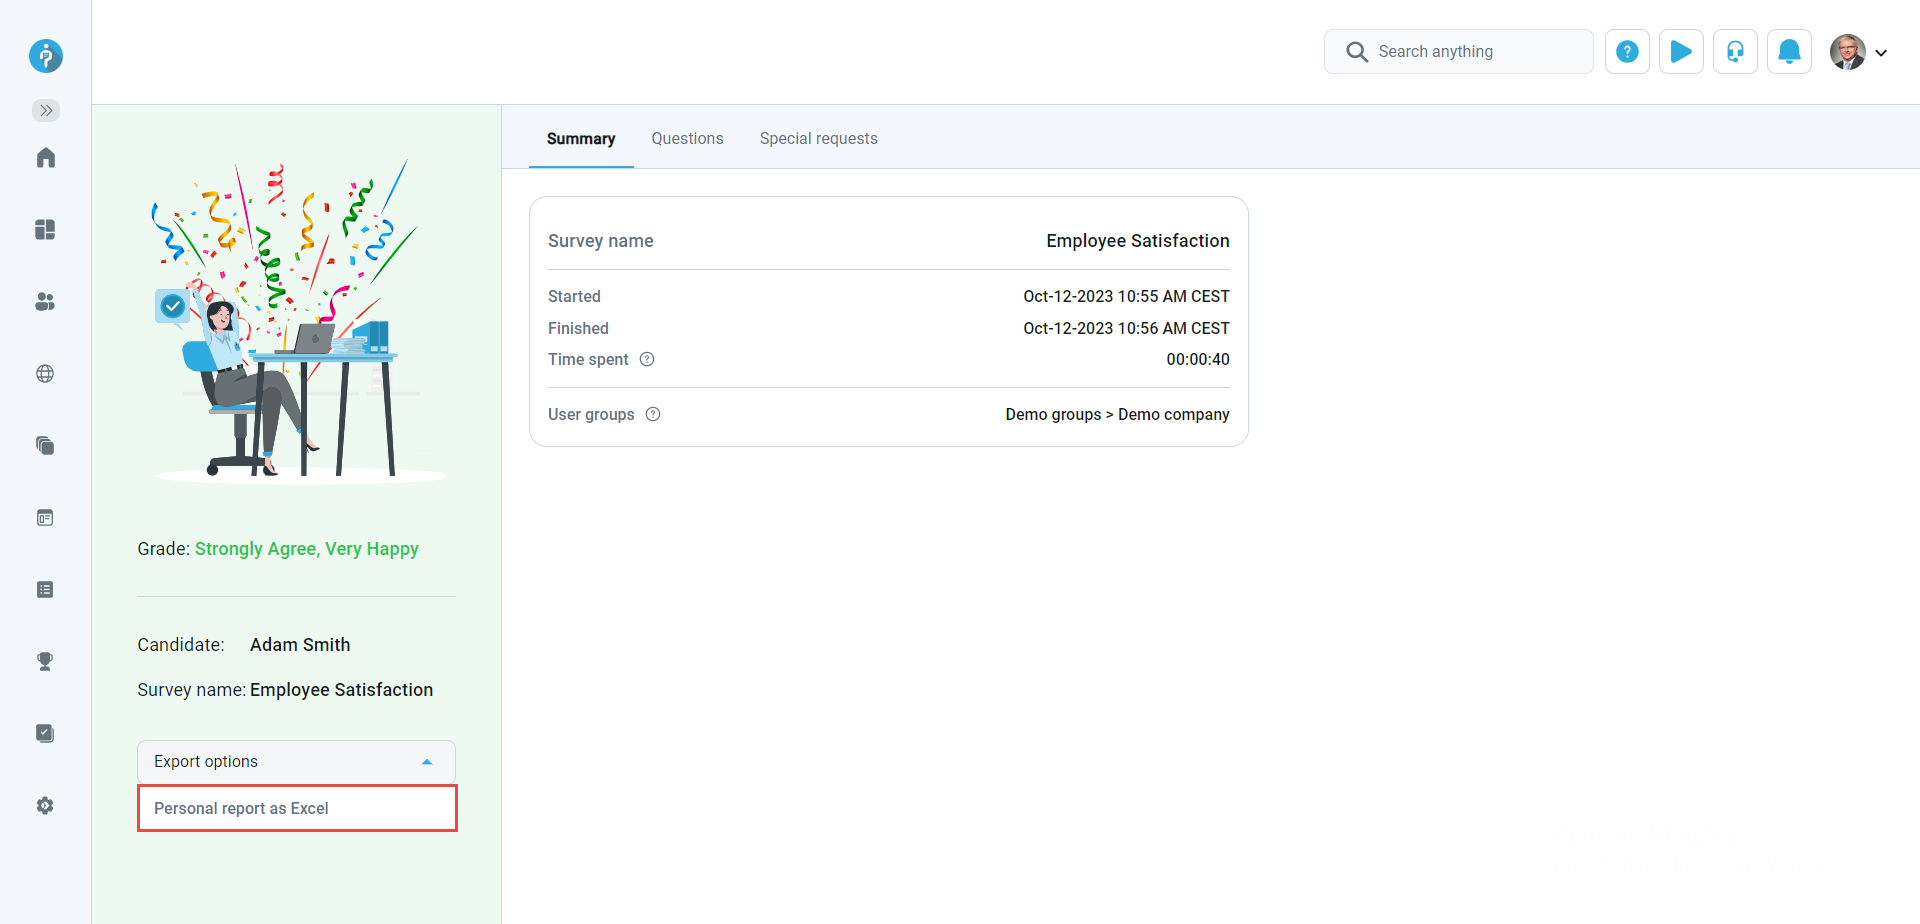
You can export your survey report in Excel format. This choice offers your report in an Excel file, providing you with the flexibility to analyze and manipulate the data as required conveniently.
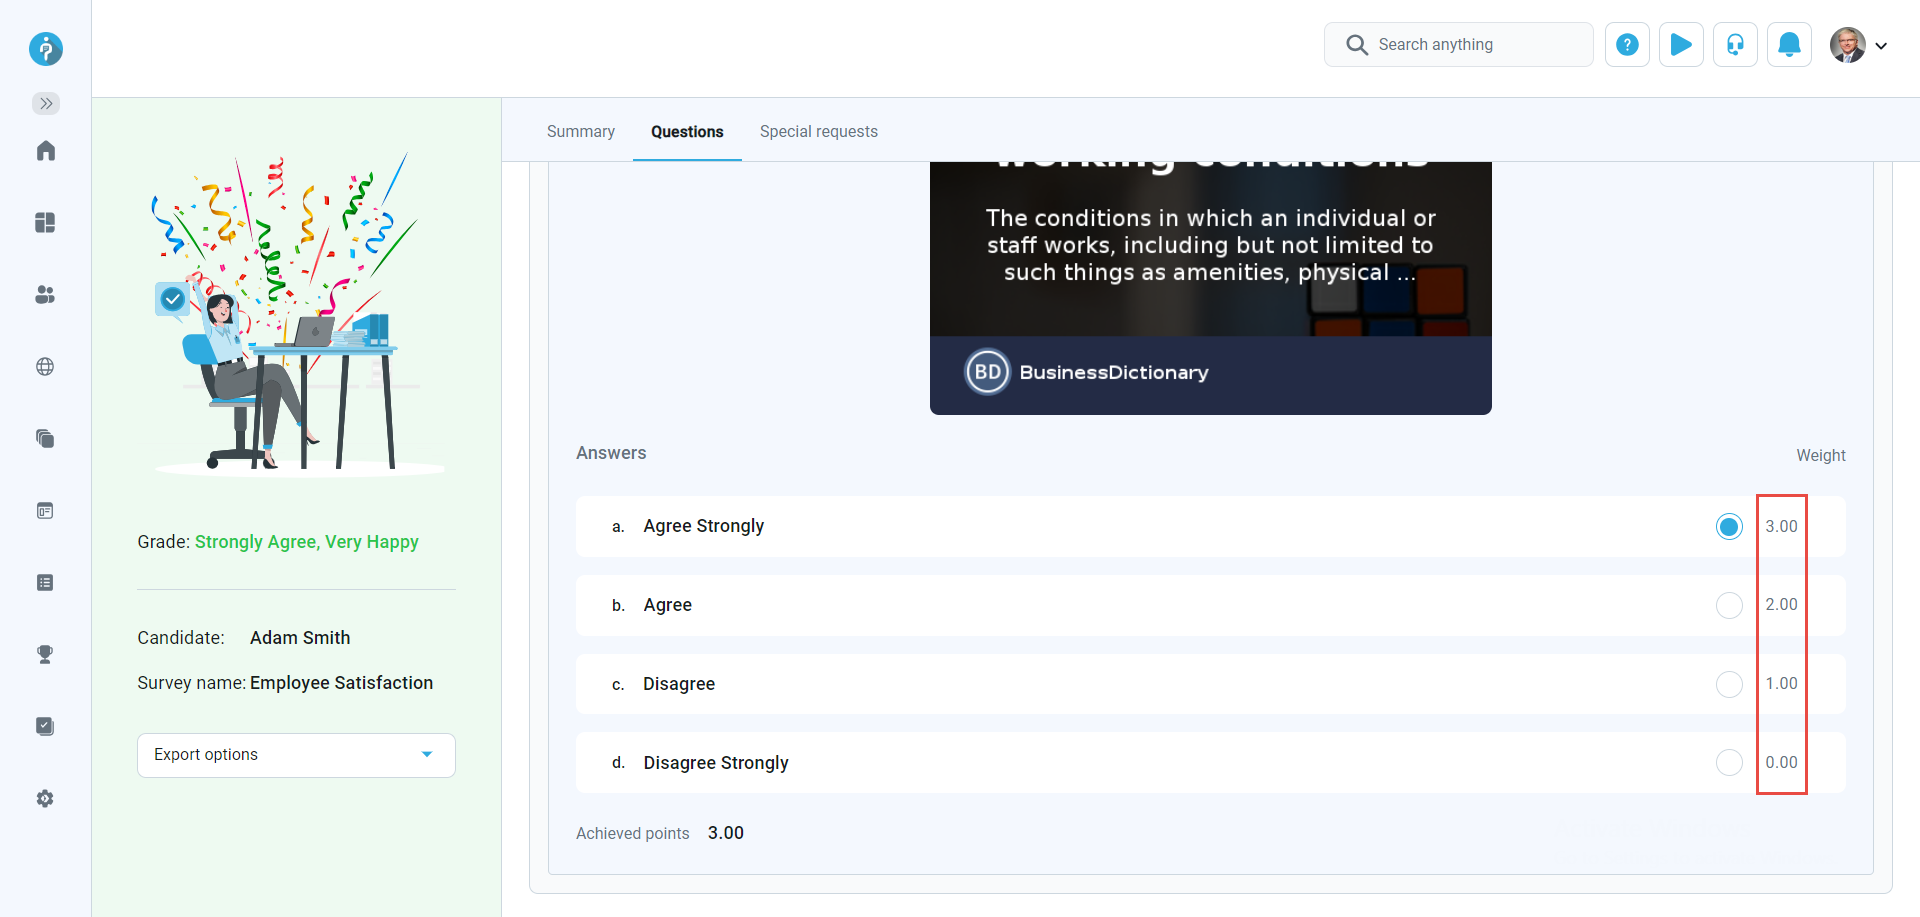
Questions
In the Questions tab, users are presented with the survey questions and their correct answers. Users can filter the questions, displaying only those with the correct or incorrect answers.
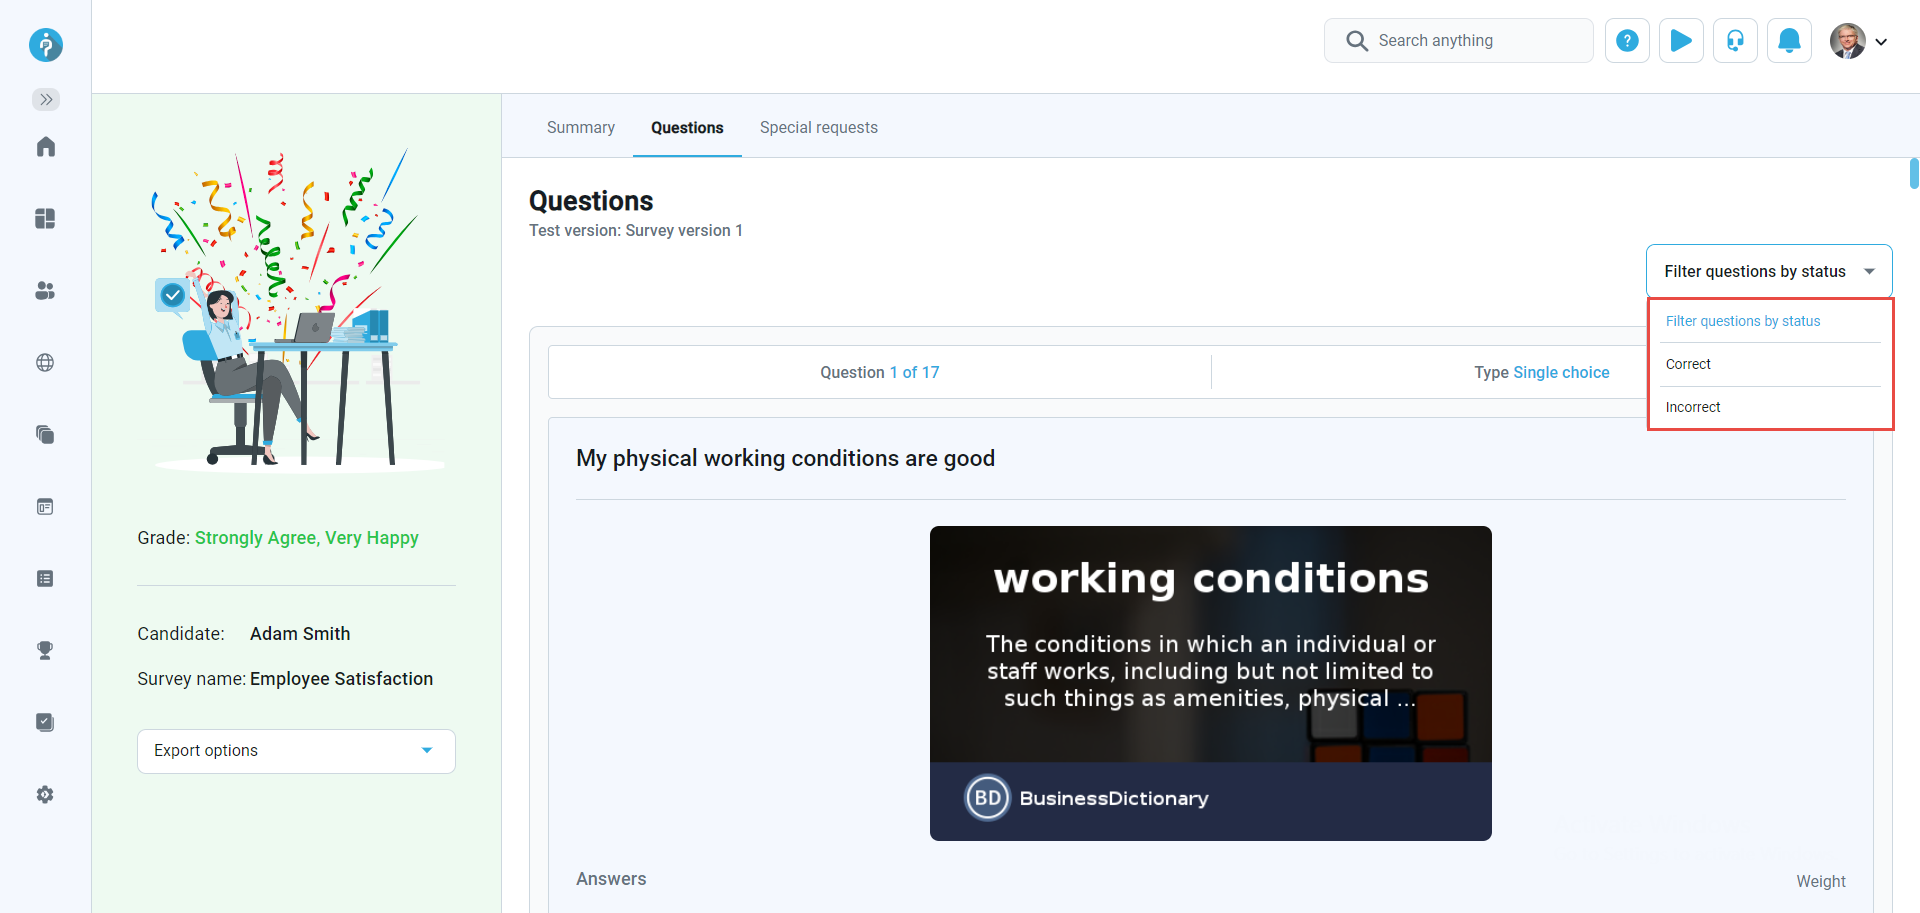
Here, you can see the weight-age assigned to each answer.
Special requests
Special requests are used to request information or documentation from candidates, either before or after a survey. For instance, if a candidate needs to provide an ID before a survey, and it's found invalid, the instructor can send a special request for a valid ID to avoid canceling the survey attempt.

-