User manual
System maintenance
-
Introduction
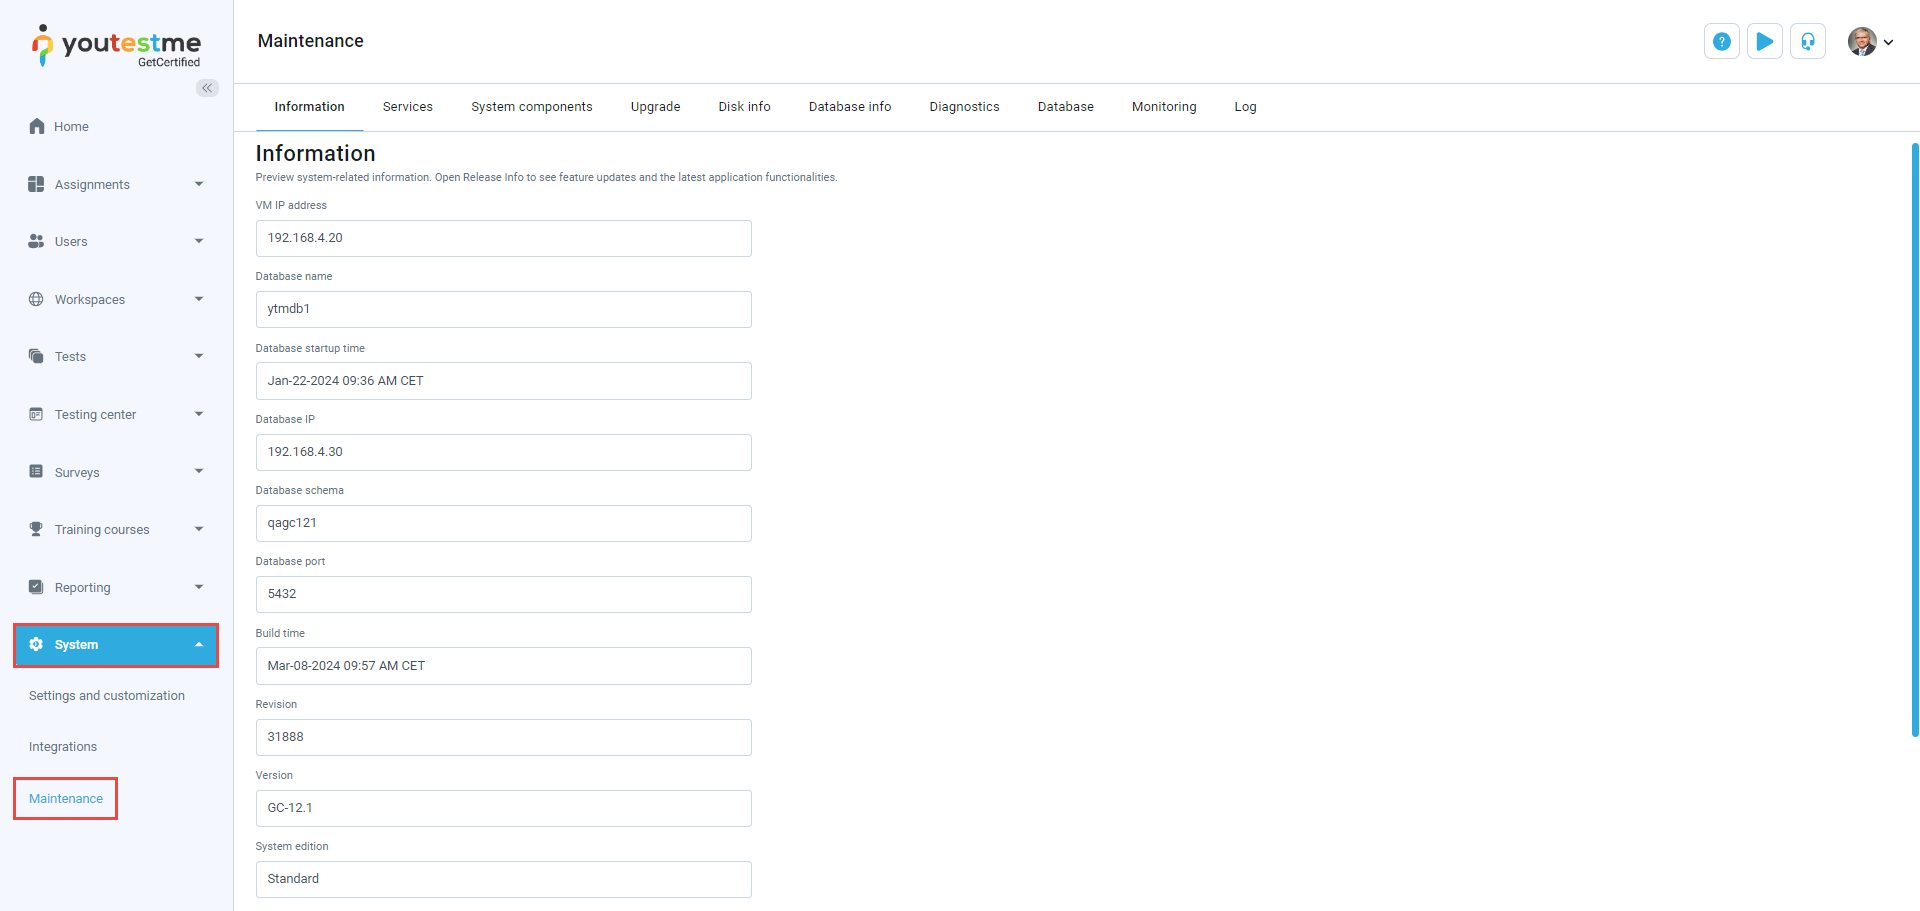
The System Maintenance page enables users to access system information, including application version, release details, disk space allocation, database information, and more. Additionally, it allows system monitoring and Tomcat log tracking.
To access the System maintenance page, navigate to the System section in the main menu, then select Maintenance.
-
Information
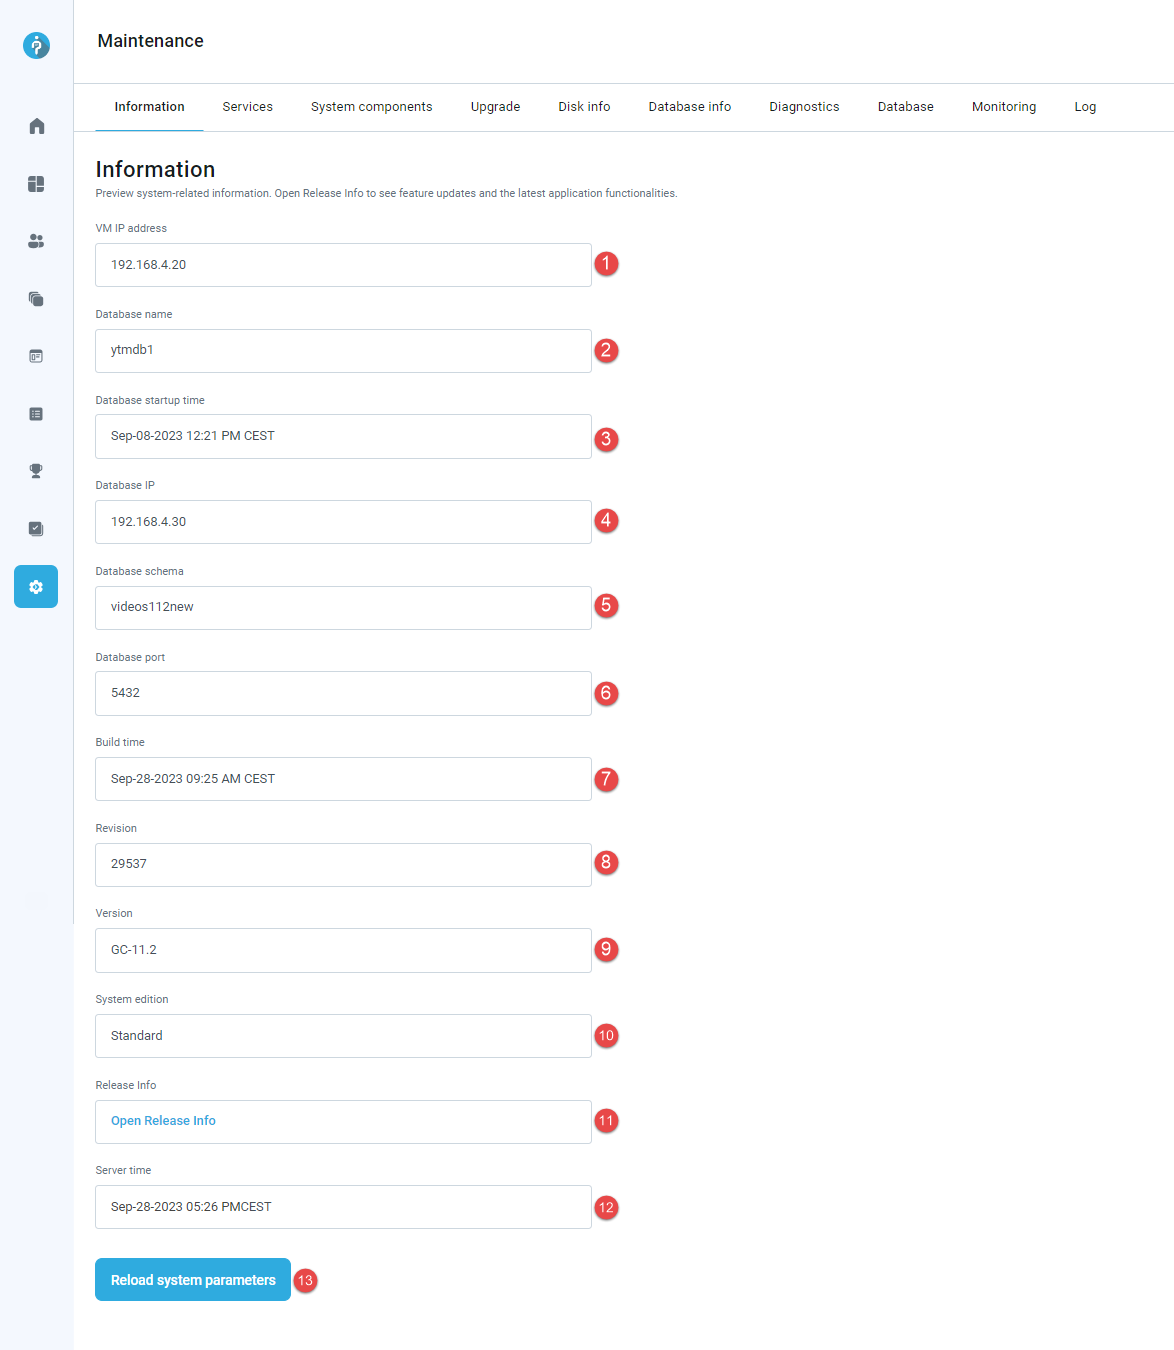
On the Information tab, you can find important system-related details. Check the release info for feature updates and the latest application functionalities.
This tab includes:
-
VM IP address - The unique address assigned to your virtual machine.
-
Database name - The name of the database associated with your application.
-
Database startup time - The timestamp indicating when the database was last started.
-
Database IP - The IP address of the database server.
-
Database schema - Name of the database schema which stores all the data related to your application.
-
Database port - The specific network port used for database communication.
-
Build time - The timestamp indicating when the application was last built.
-
Revision - The revision number indicating the version of the application.
-
Version - The version number of your application.
-
System edition - The specific edition or version of the system you are using.
-
Release info - Information about your application's latest feature updates and enhancements. Click the Open release info button to open it in a new tab.
-
Server time - The current timestamp on the server where your application is hosted.
-
Reload system parameters - Refresh and apply any changes to the system settings, ensuring they take effect immediately.
-
-
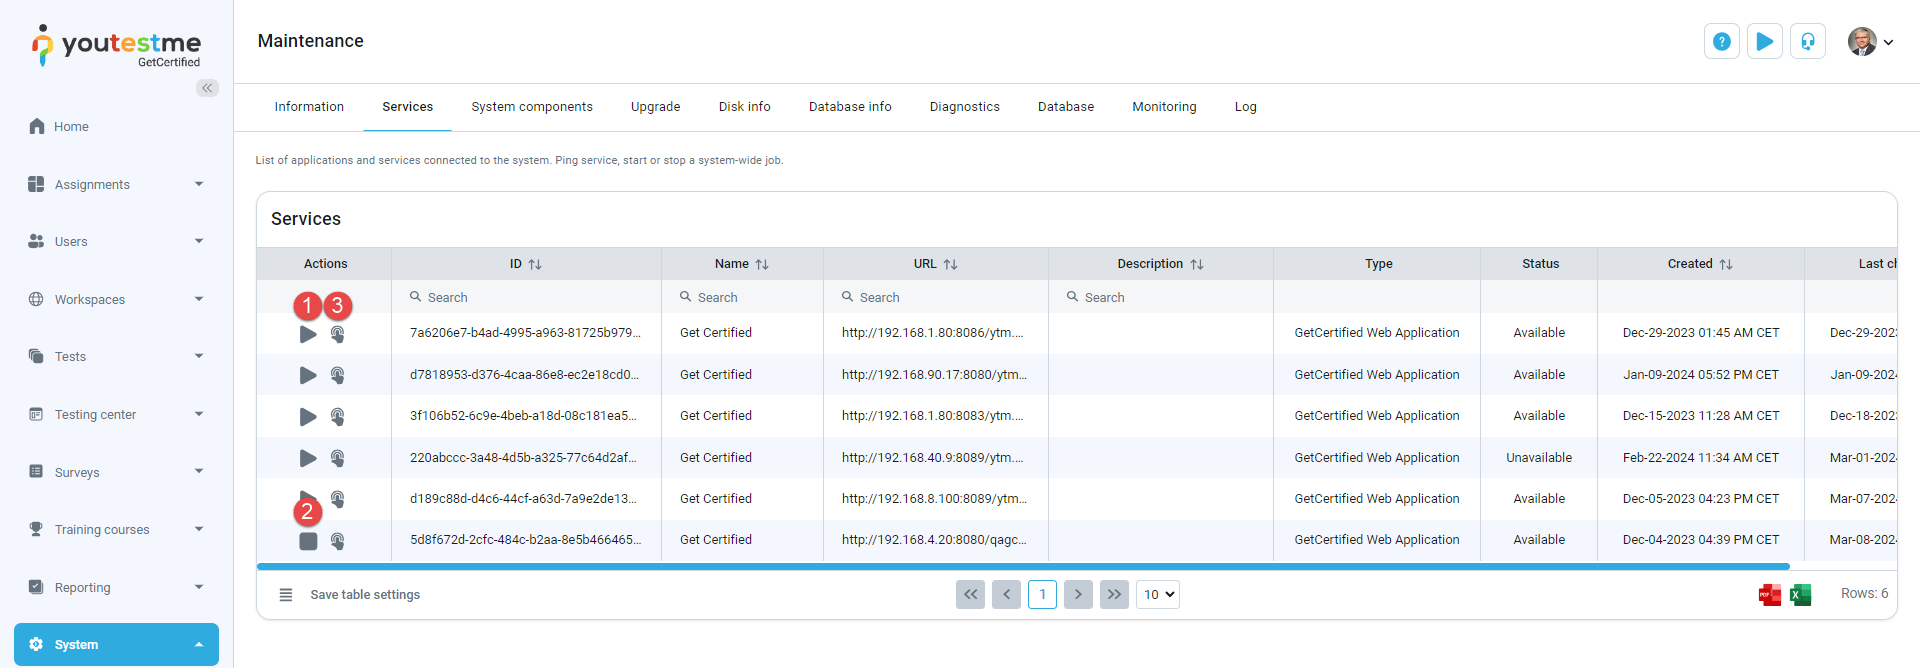
Services
View a list of all applications and services connected to your system. You can export the list of services in XLS, PDF, CSV, or XML format.
On the Services tab, you can:
-
Start system-wide job.
In the system, three types of jobs should only be handled by a single service: Batch mail jobs, Scheduled report jobs, and Jobs scheduled in the Jobs Dashboard. Multiple services should not execute these jobs for smooth system operation.
-
Stop system-wide job.
-
Ping service to check its reachability from the application.
-
If the service is unreachable, you will receive the message "Service failed to respond", and the service's status will change to unavailable.
-
If the service is reachable, you will receive the message "Service responded", and the service's status will change to available.
-
-
-
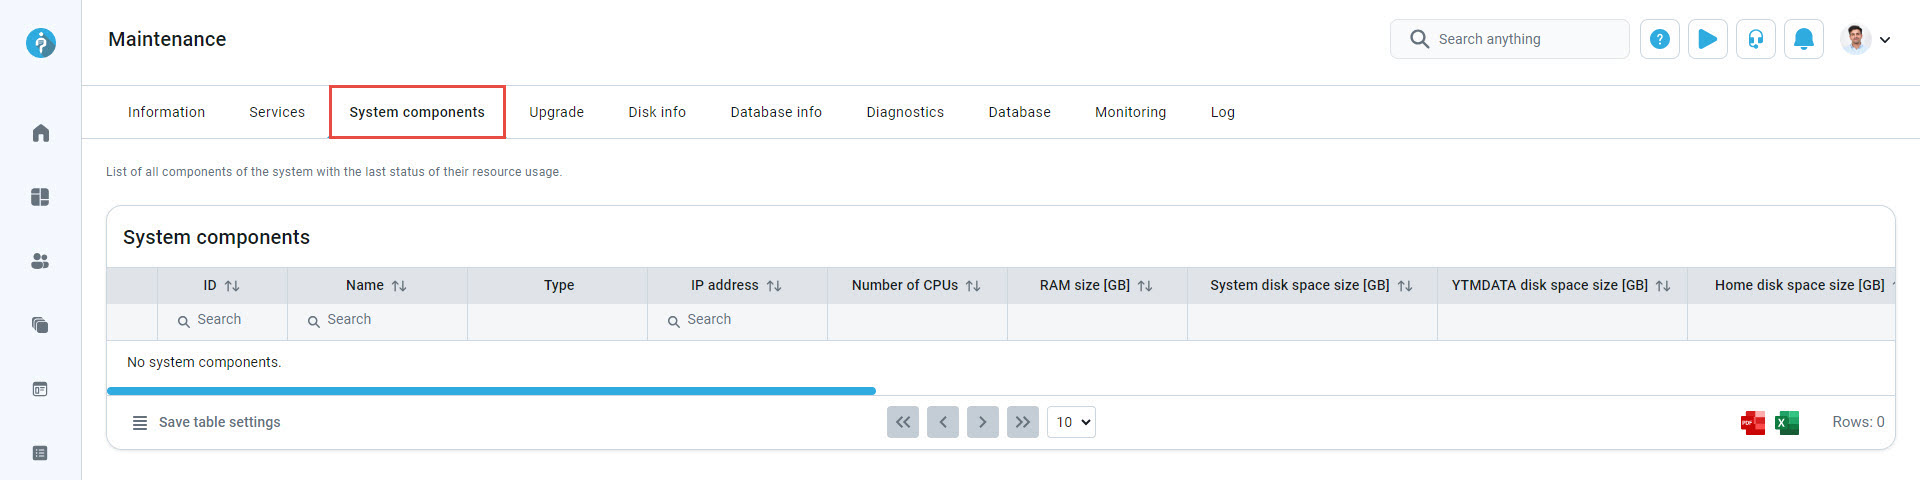
System components
The System components tab serves as a directory of all essential components that enable your system's functionality. It displays a list of these parts and their utilization of resources such as memory and processing power.
This is useful for monitoring your system's health. If any component is utilizing fewer resources, it could potentially slow down operations. By checking this tab, you can identify and resolve these issues to ensure your system runs smoothly.
-
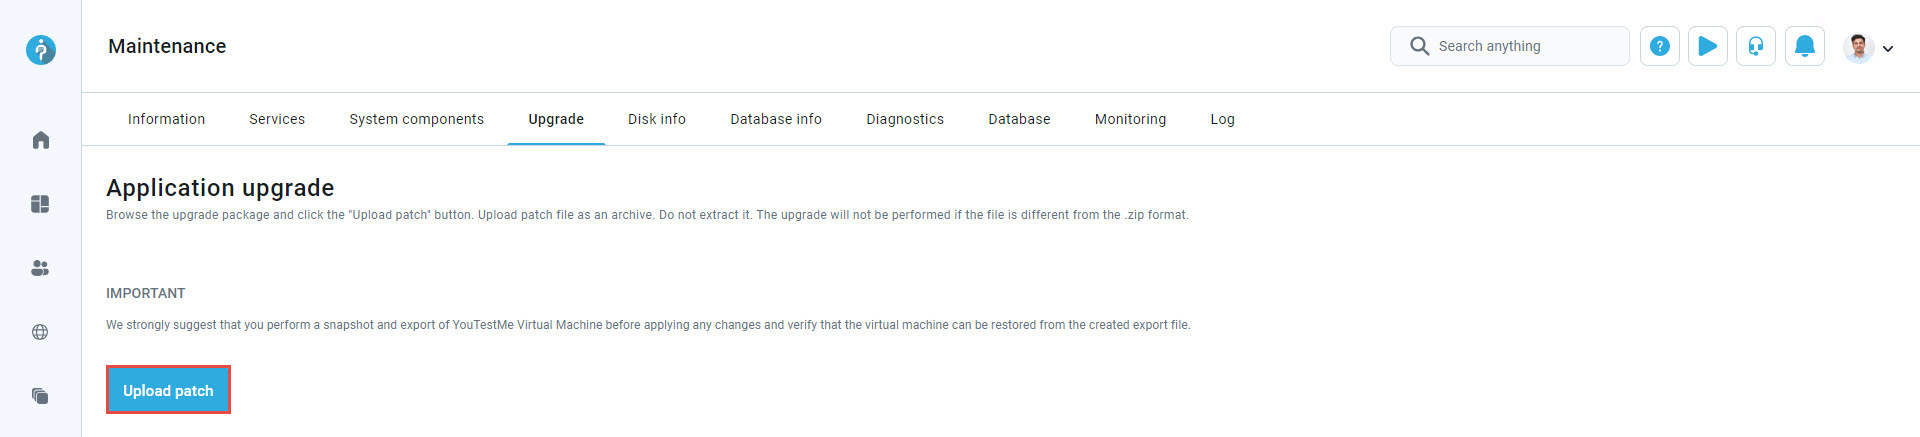
Upgrade
Browse the upgrade package and click the Upload patch button. Upload the patch file as an archive without extracting it. Please note that the upgrade will not proceed if the file format differs from .zip.
This option is exclusively available for On-premise hosting.
Important: Before applying any changes, we strongly recommend performing a snapshot and export of the YouTestMe Virtual Machine. Verify that the virtual machine can be restored from the created export file.
-
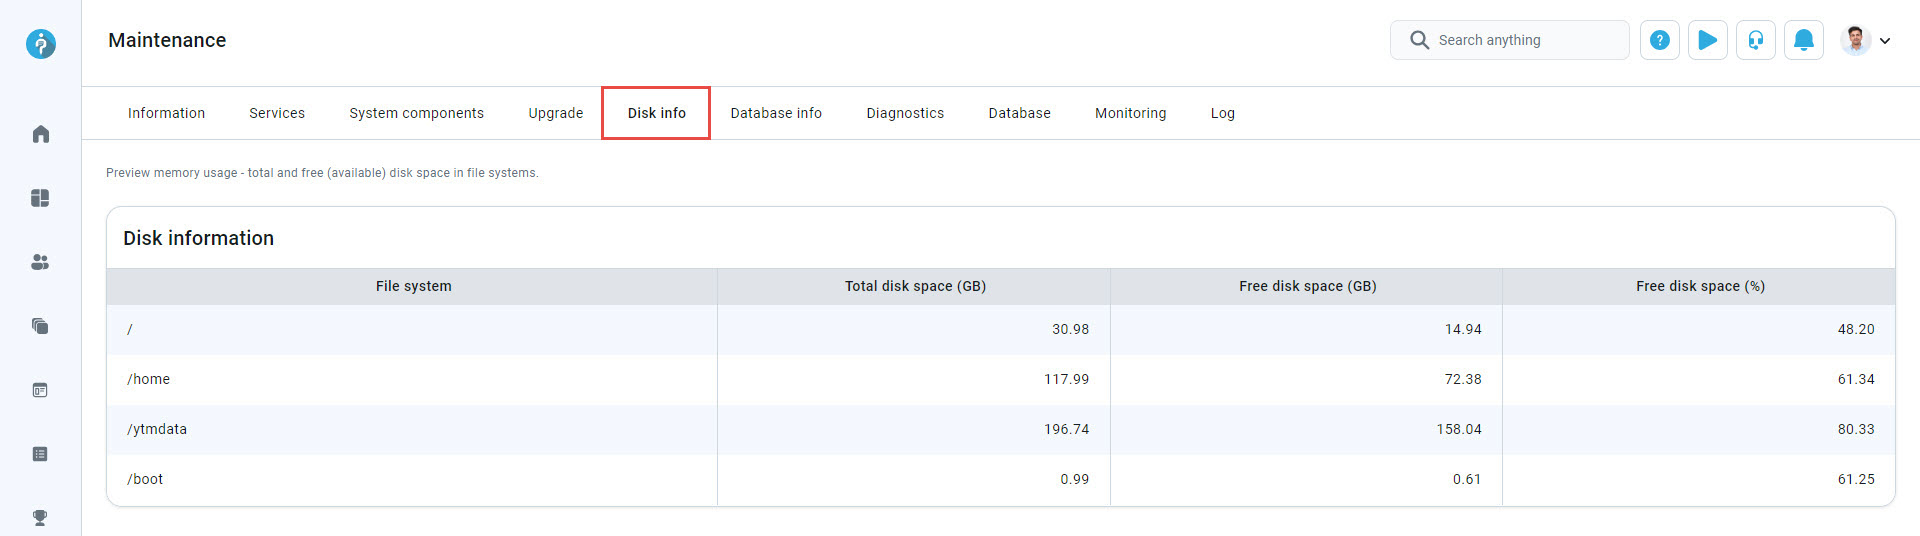
Disk info
On the Disk info tab, you can view details such as the total storage capacity, used space, and available free space.
Regularly checking the this tab allows you to proactively manage disk space, identify potential storage issues, and take action to prevent problems. This ensures your Linux virtual machine operates efficiently without interruptions.
-
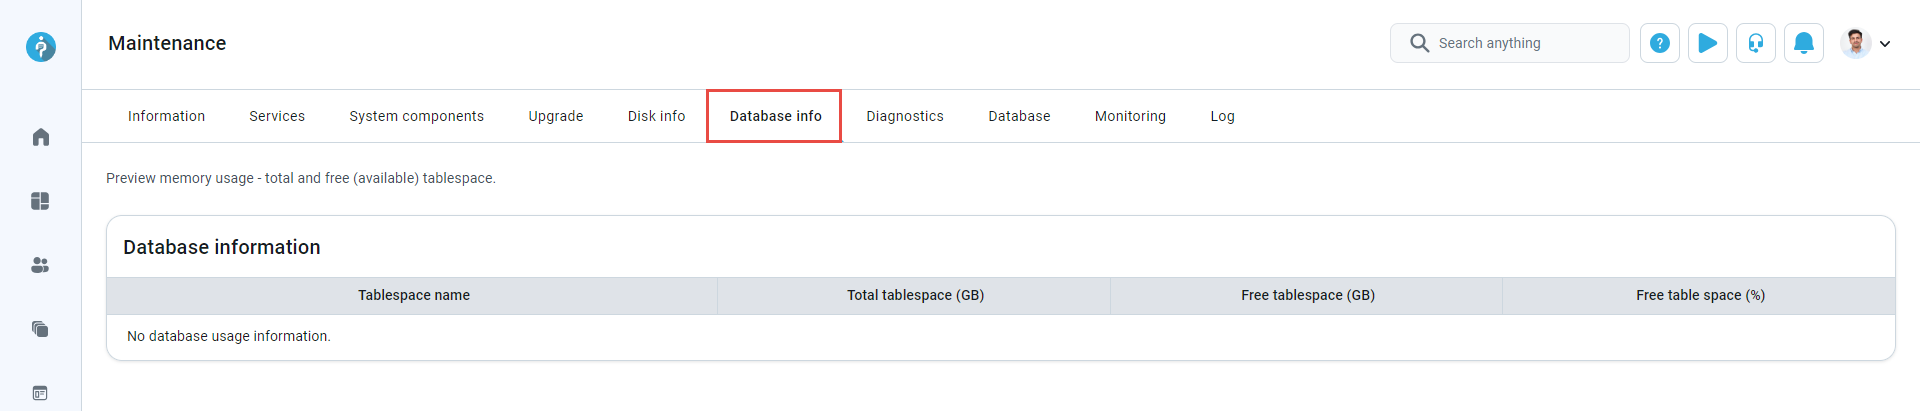
Database info
The Database info tab contains details on stored aggregations of data records or files containing information such as user data, test results, survey responses, and more. Databases are essential for storing, maintaining, and accessing data, collecting information on users, tests, or applications.
-
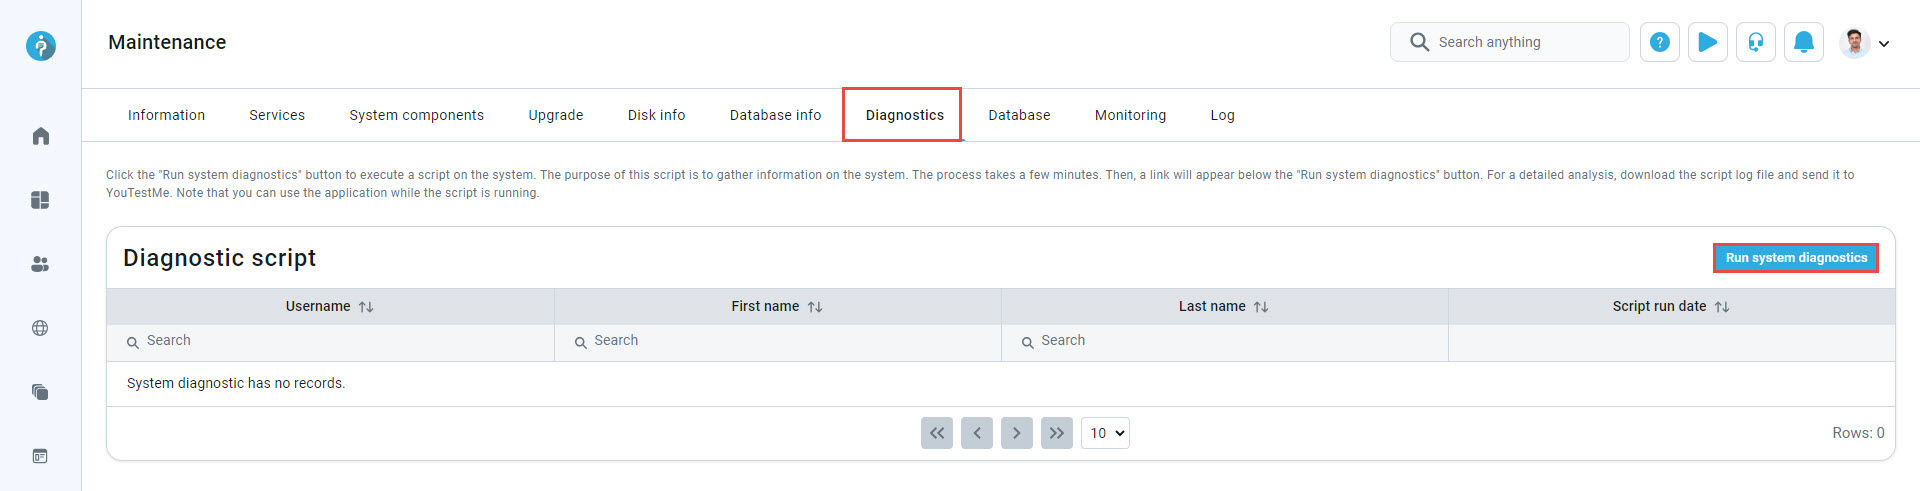
Diagnostics
Click the Run system diagnostic button to execute a system script aimed at gathering system information. This process may take a few minutes. Once completed, a link will appear below the button.
For a comprehensive analysis, download the script log file and forward it to YouTestMe. Please do not close this browser tab while the script is running. If you close it, the script will not complete its download. You can continue your work in the application by opening a new tab.
This feature is exclusive to On-premise hosting.
-
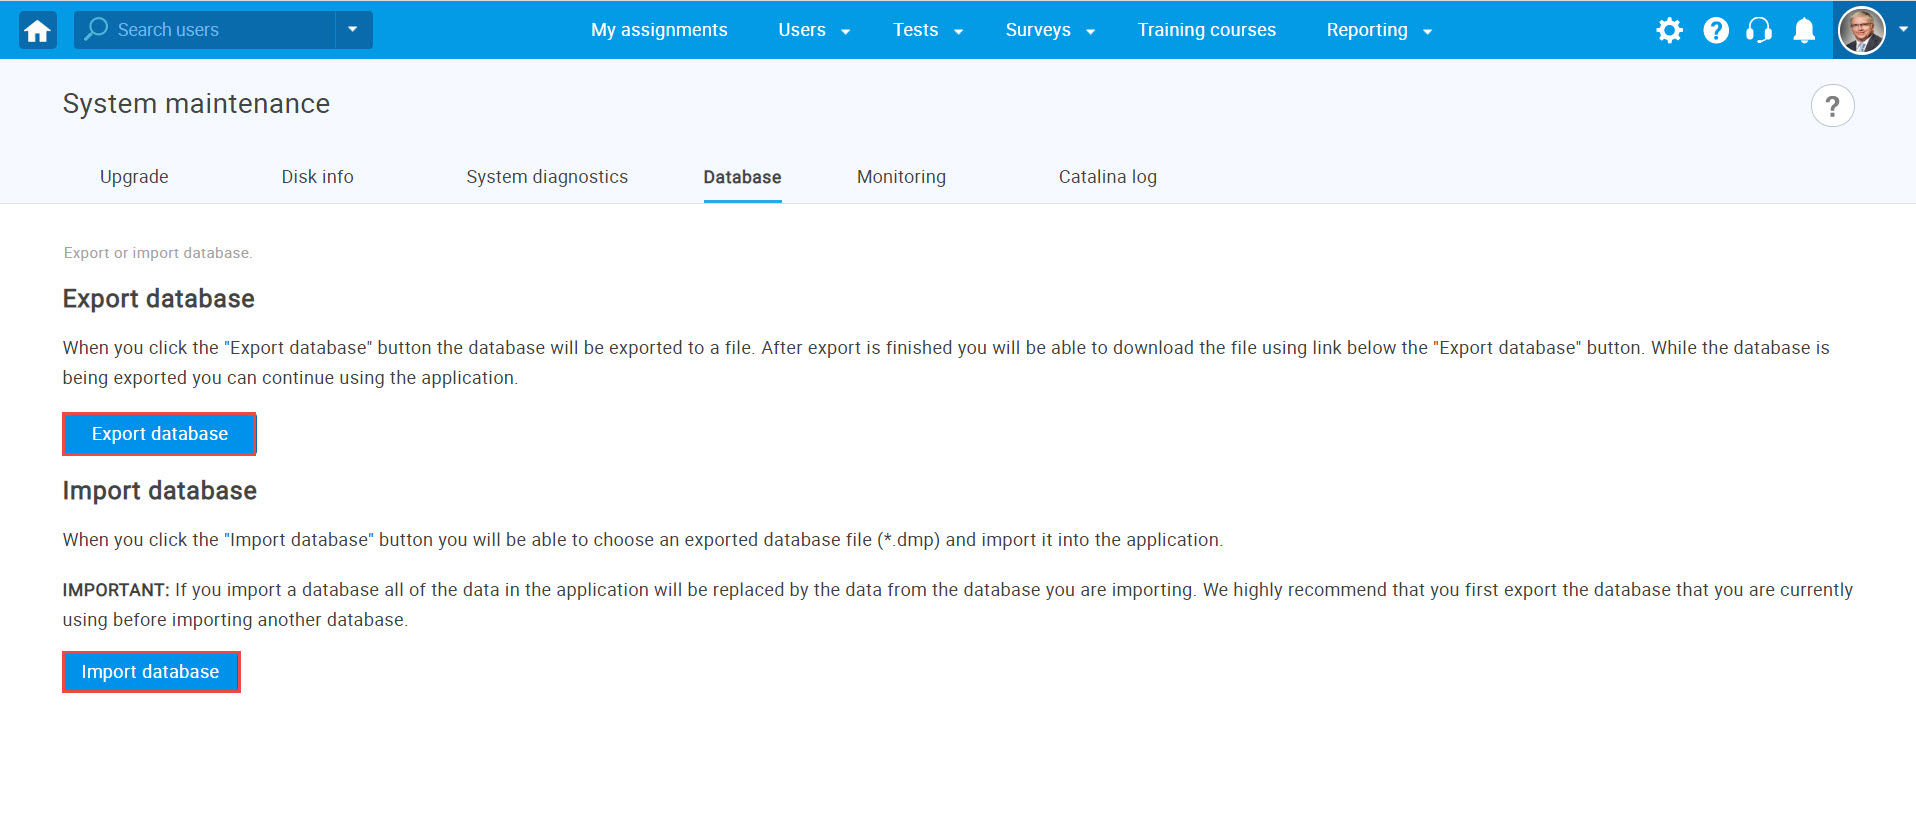
Database
Use the Database tab to manage your application's database. This feature is exclusive to On-premise hosting.
-
When you click the Export database button, the database will be exported to a file. Once the export is completed, you can download the file using the link provided below the button. You can continue using the application while the database is being exported.
-
Click the Import database button to choose an exported database file (*.dmp) and import it into the application. Importing a database will replace all existing data in the application with the data from the imported database. We strongly recommend exporting your current database before proceeding with the import.
-
-
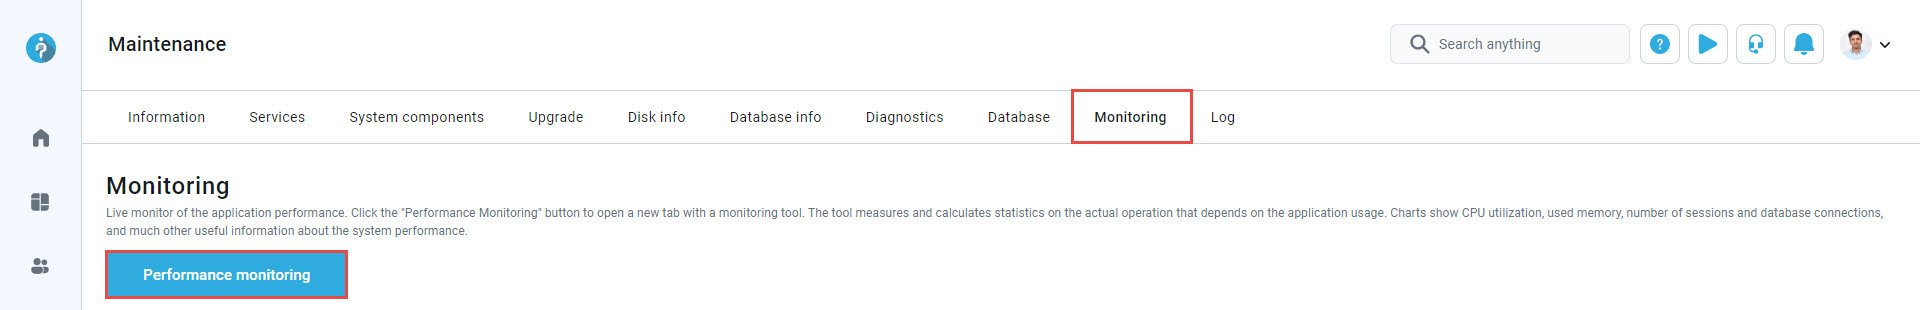
Monitoring
Clicking the Performance monitoring button will open a new tab with a monitoring tool. This tool measures and calculates statistics on the application's operation based on user usage, focusing on request statistics and evolution charts.
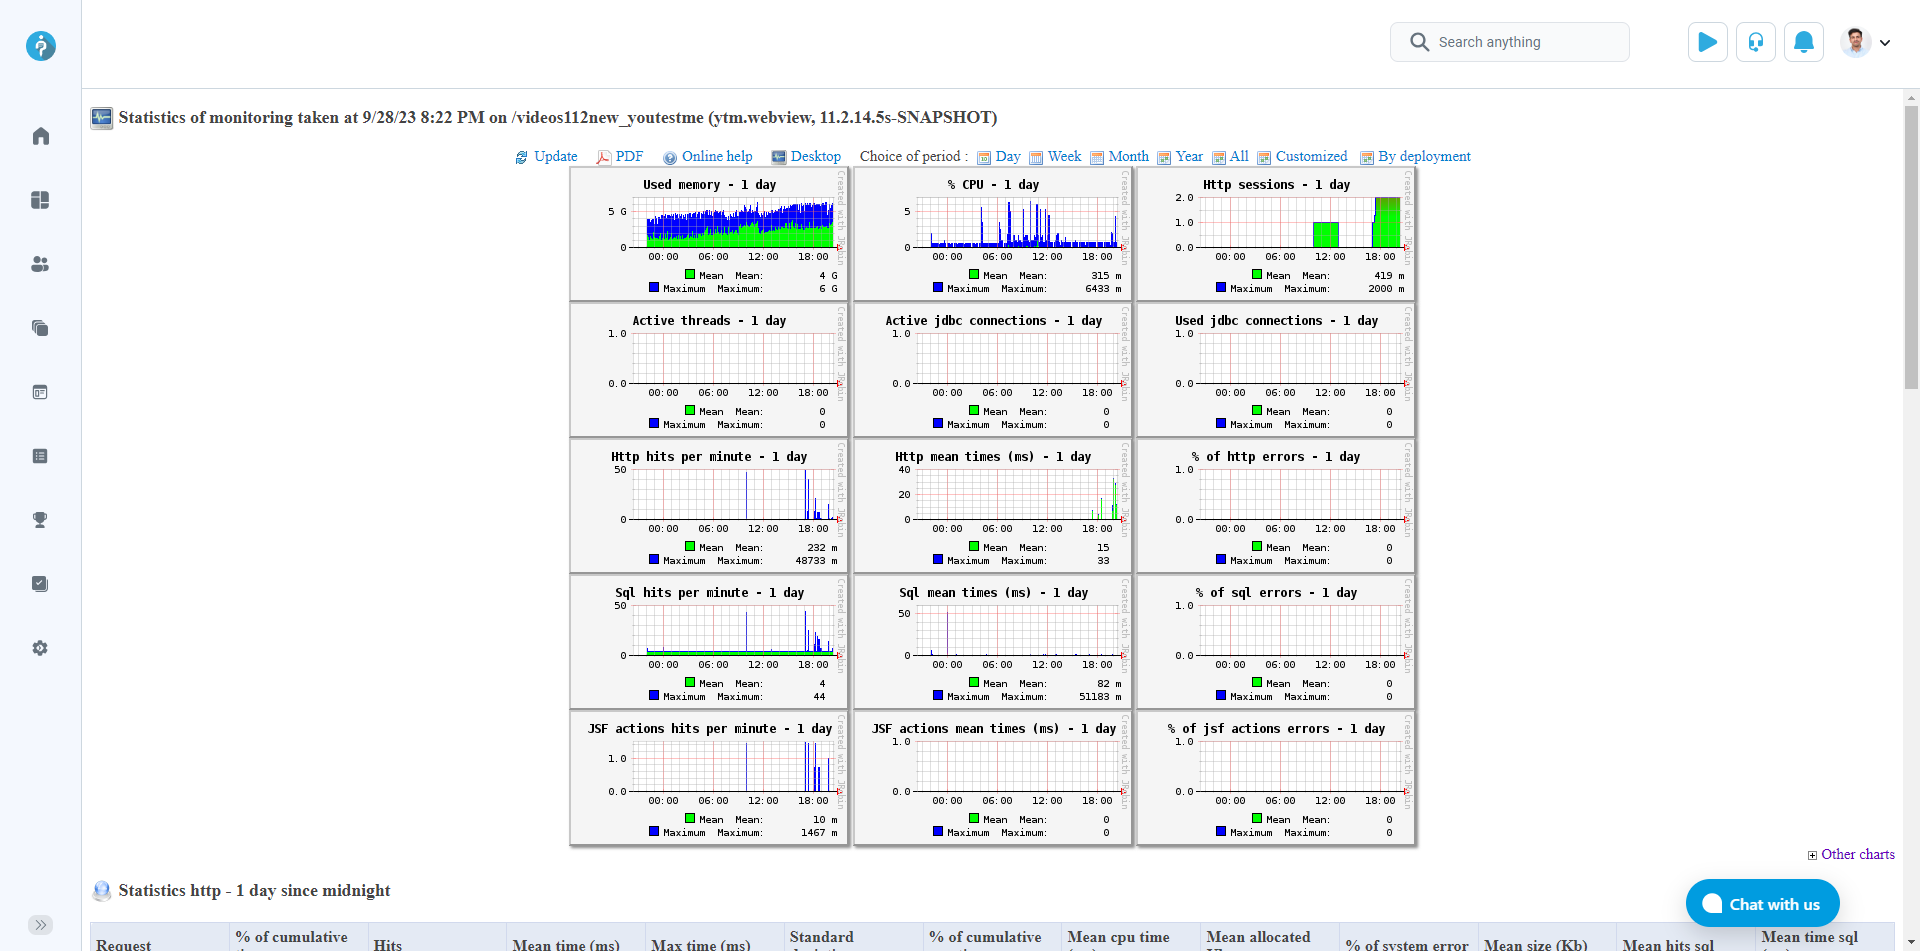
The image below displays monitoring statistics captured at a specific date and time, categorized accordingly.
One crucial statistic you can measure is the number of active HTTP sessions during a predefined period. You can preview the statistics report, which includes the number of concurrent users.
You can access the statistics report containing the number of concurrent users in two ways:
-
Click on HTTP sessions - 1 day to preview reports on connected users during the chosen time (in this case, throughout the day).
-
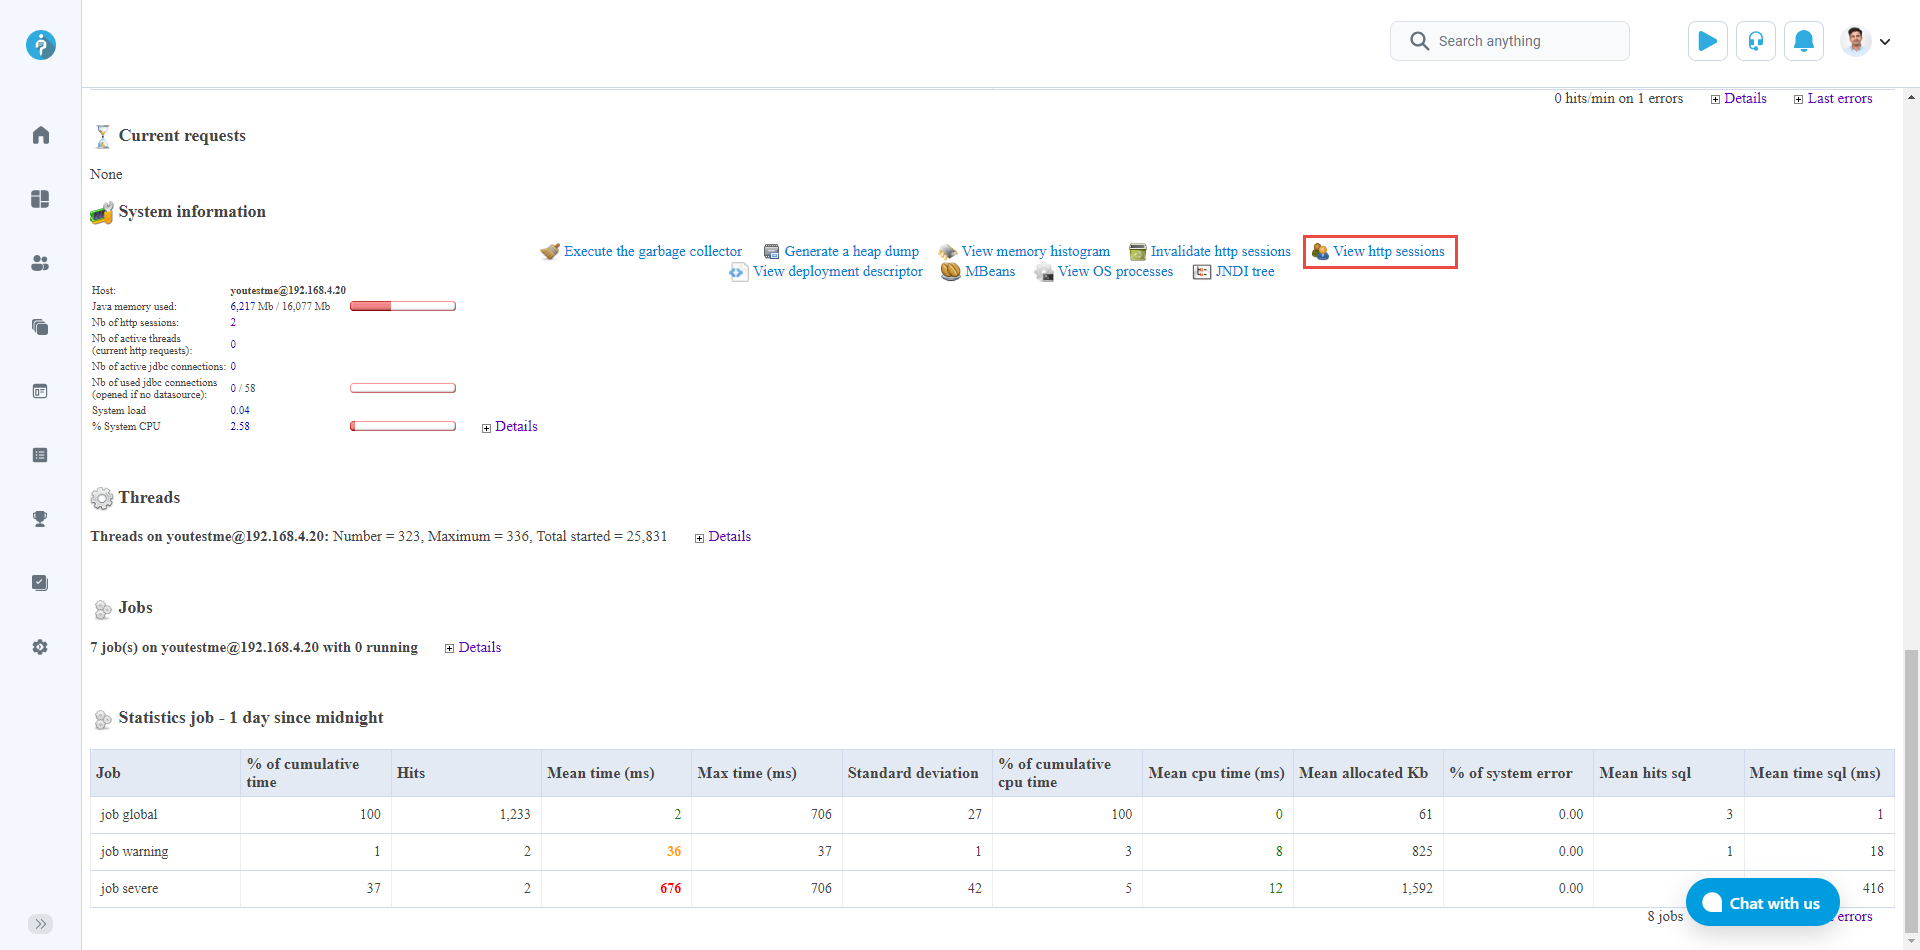
Under System information on the same page, click the link labeled View HTTP sessions.
-
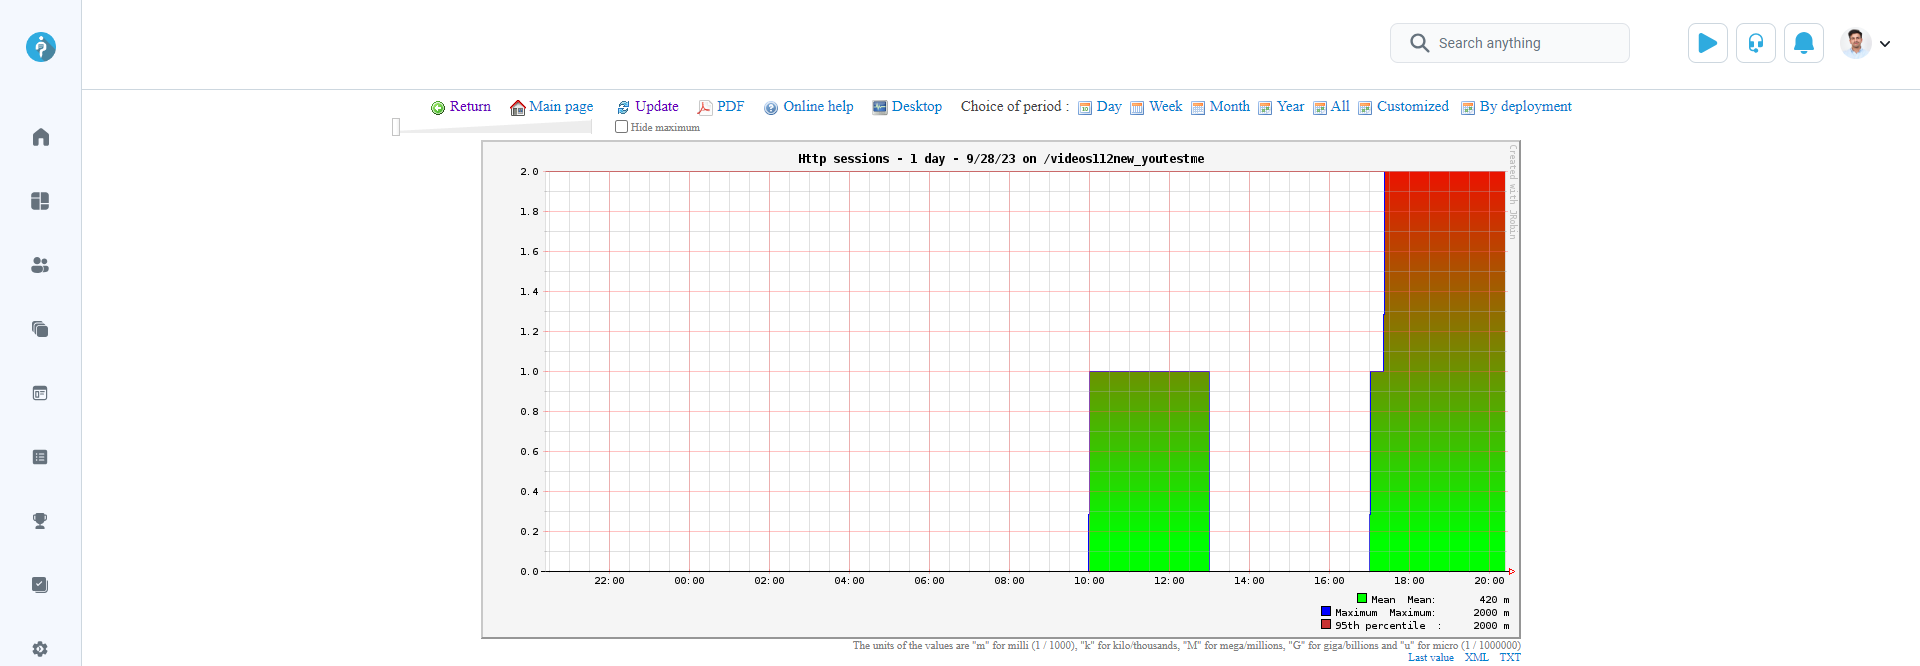
HTTP sessions - 1 day
After selecting the HTTP sessions - 1 day option, you'll see a report displaying the number of HTTP sessions per day. The report also indicates the duration of each session by user. The chart depicts the number of users logged into the application within the specified time period. The monitoring tool tracks user sign-ins per session over time. Refer to the chart report below to preview the number of HTTP sessions throughout the day.
Note: One HTTP session is equivalent to the one signed-in user.
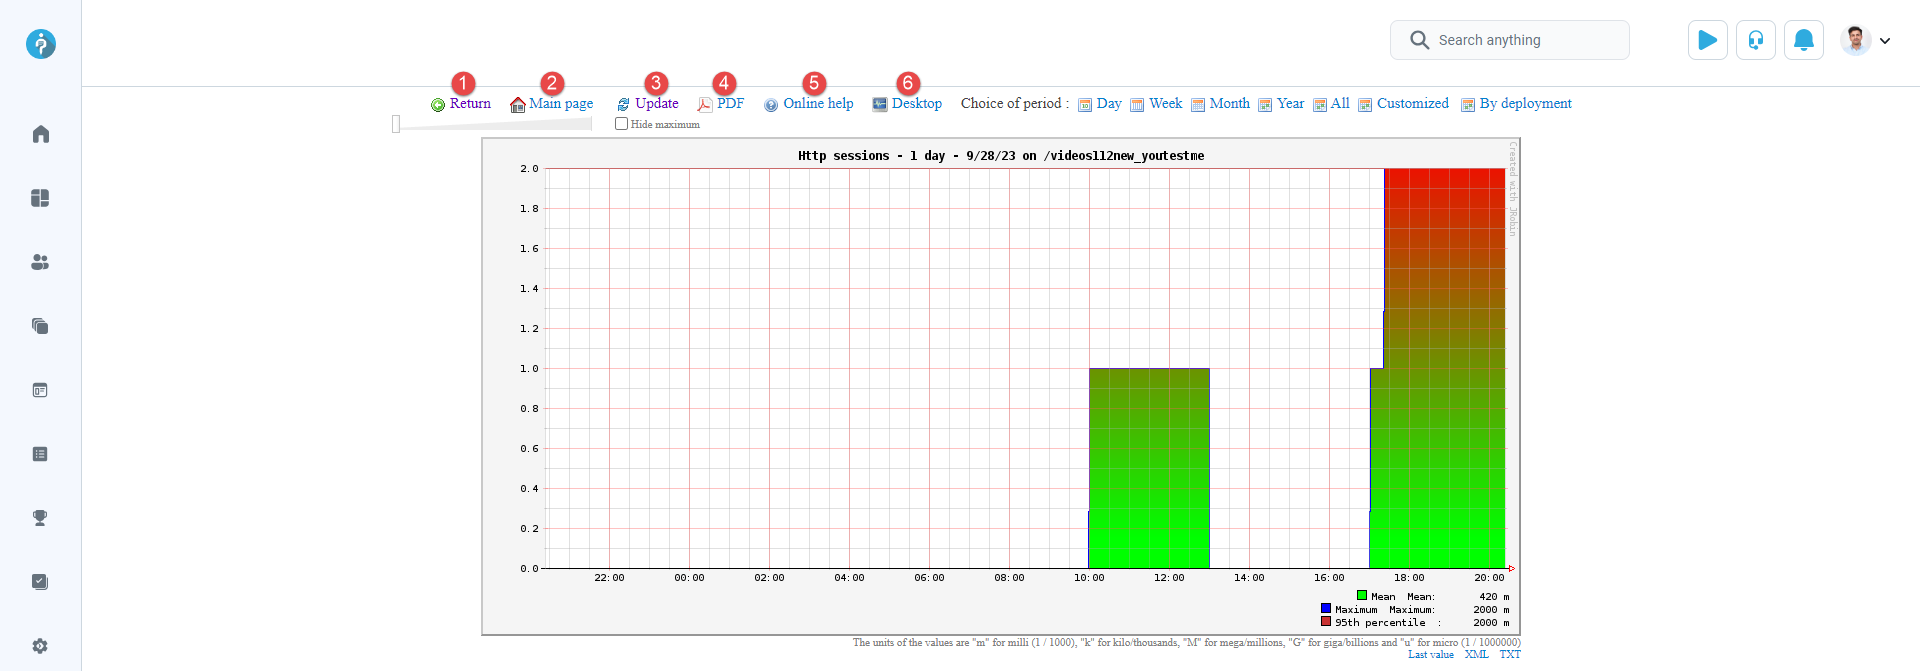
Actions available with the HTTP sessions report include:
-
Return to the monitoring home page.
-
Main page - Returns you to the monitoring home page.
-
Update the chart./p>
-
Display reports in PDF format.
-
Online help - Opens the monitoring tool's help page in a new tab.
-
Desktop - Download the monitoring tool on your computer.
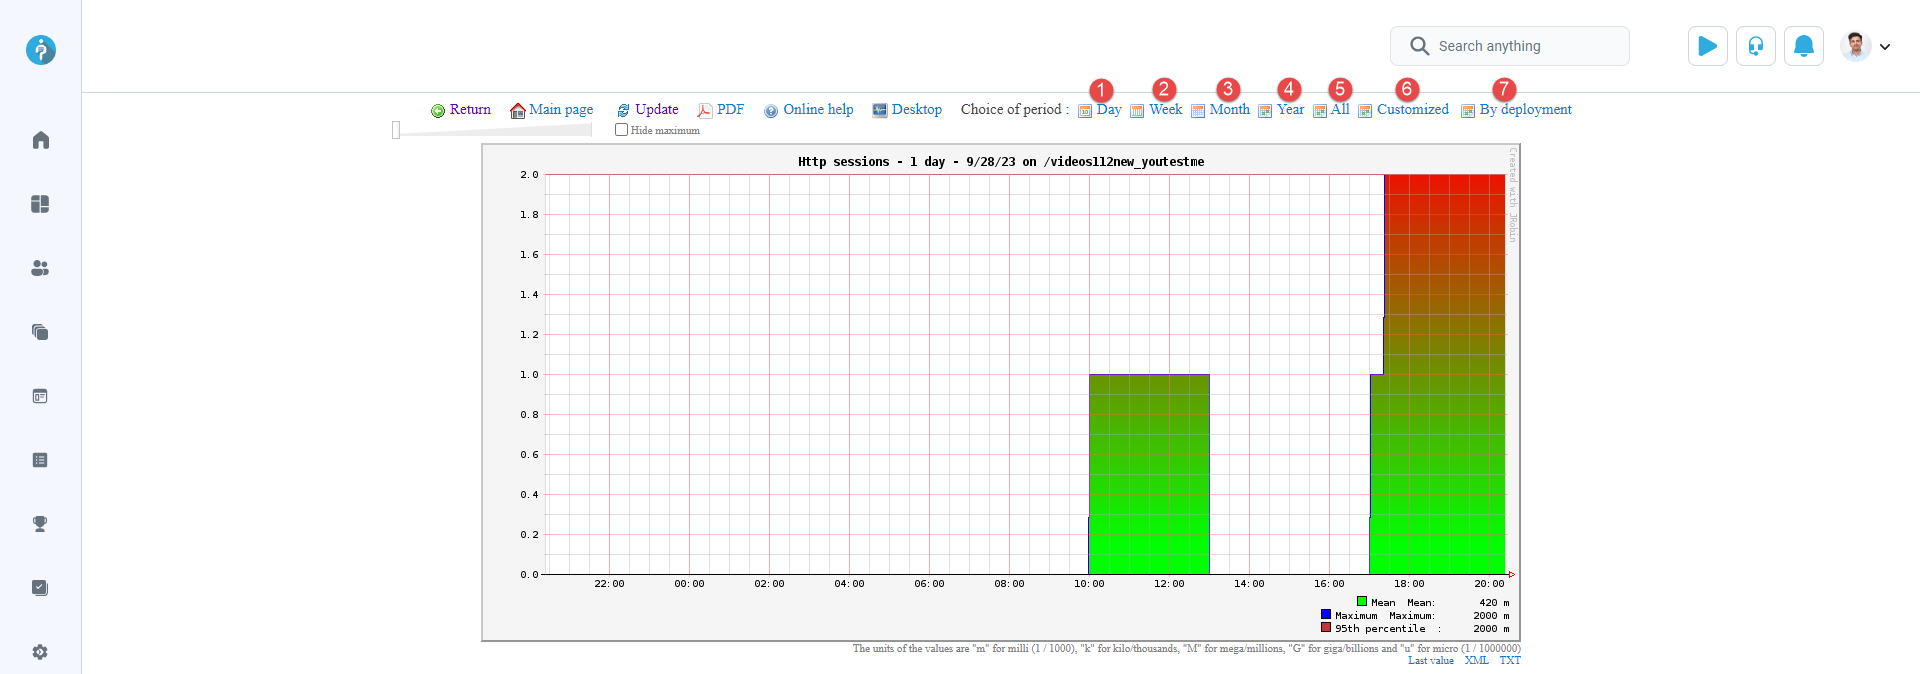
Additionally, you have the option to customize the period for viewing the report. You can choose:
-
Day – Preview daily statistics report.
-
Week – Preview weekly statistics report.
-
Month – Preview monthly statistics report.
-
Year – Preview yearly statistics report.
-
All – View the report for all periods.
-
Customized – Select a specific period by choosing start and end dates.
-
By deployment – Choose a system version to preview the report.
-
-
View HTTP sessions
To preview a report click the View HTTP session link.
The report includes the following columns:
-
Session ID – The identification number of a session.
-
Last access – The timestamp when the user accessed the session.
-
Age – The duration of the session.
-
Expiration – The exact time when the session expires.
-
IP address – The user's IP address.
-
Country – The location of the user signed into the HTTP session.
-
Browser – The browser used to start the session.
-
OS – The operating system of the user's computer.
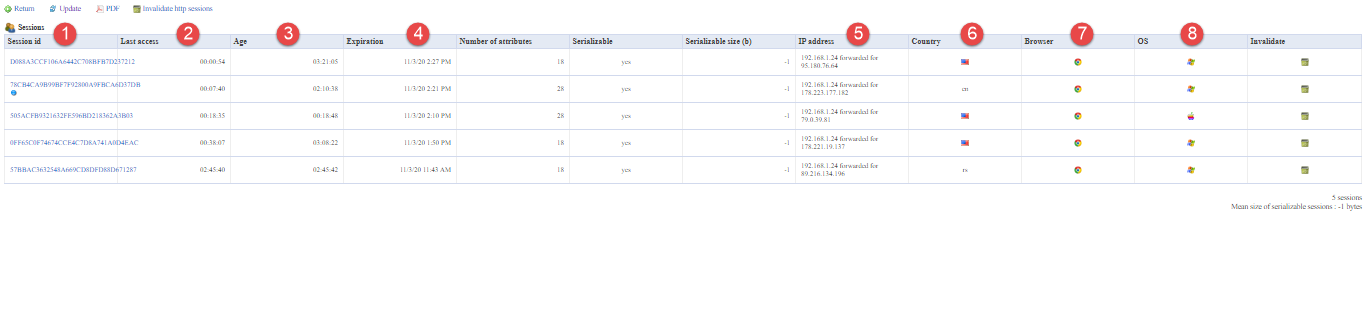
Note: These columns are essential for administrators and statistical analysis. Number of attributes, Serializable, and Serializable size are additional attributes in the table.
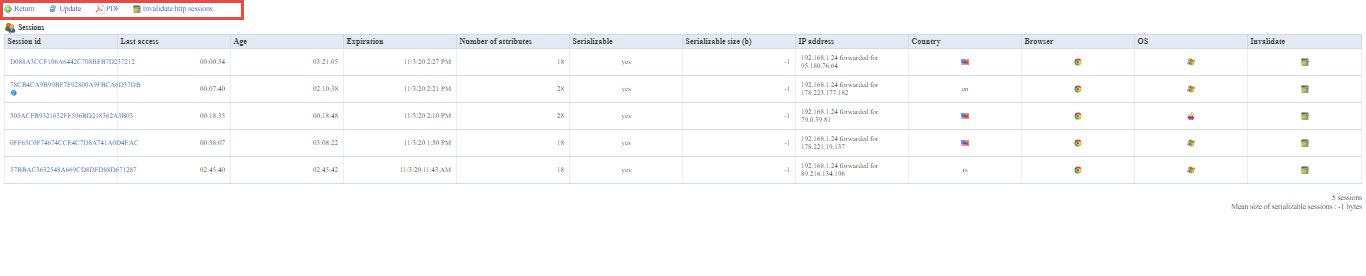
You can also perform the following actions:
-
Return back.
-
Update the table.
-
Display the report in PDF format.
-
Invalidate the HTTP sessions.
-
-
-
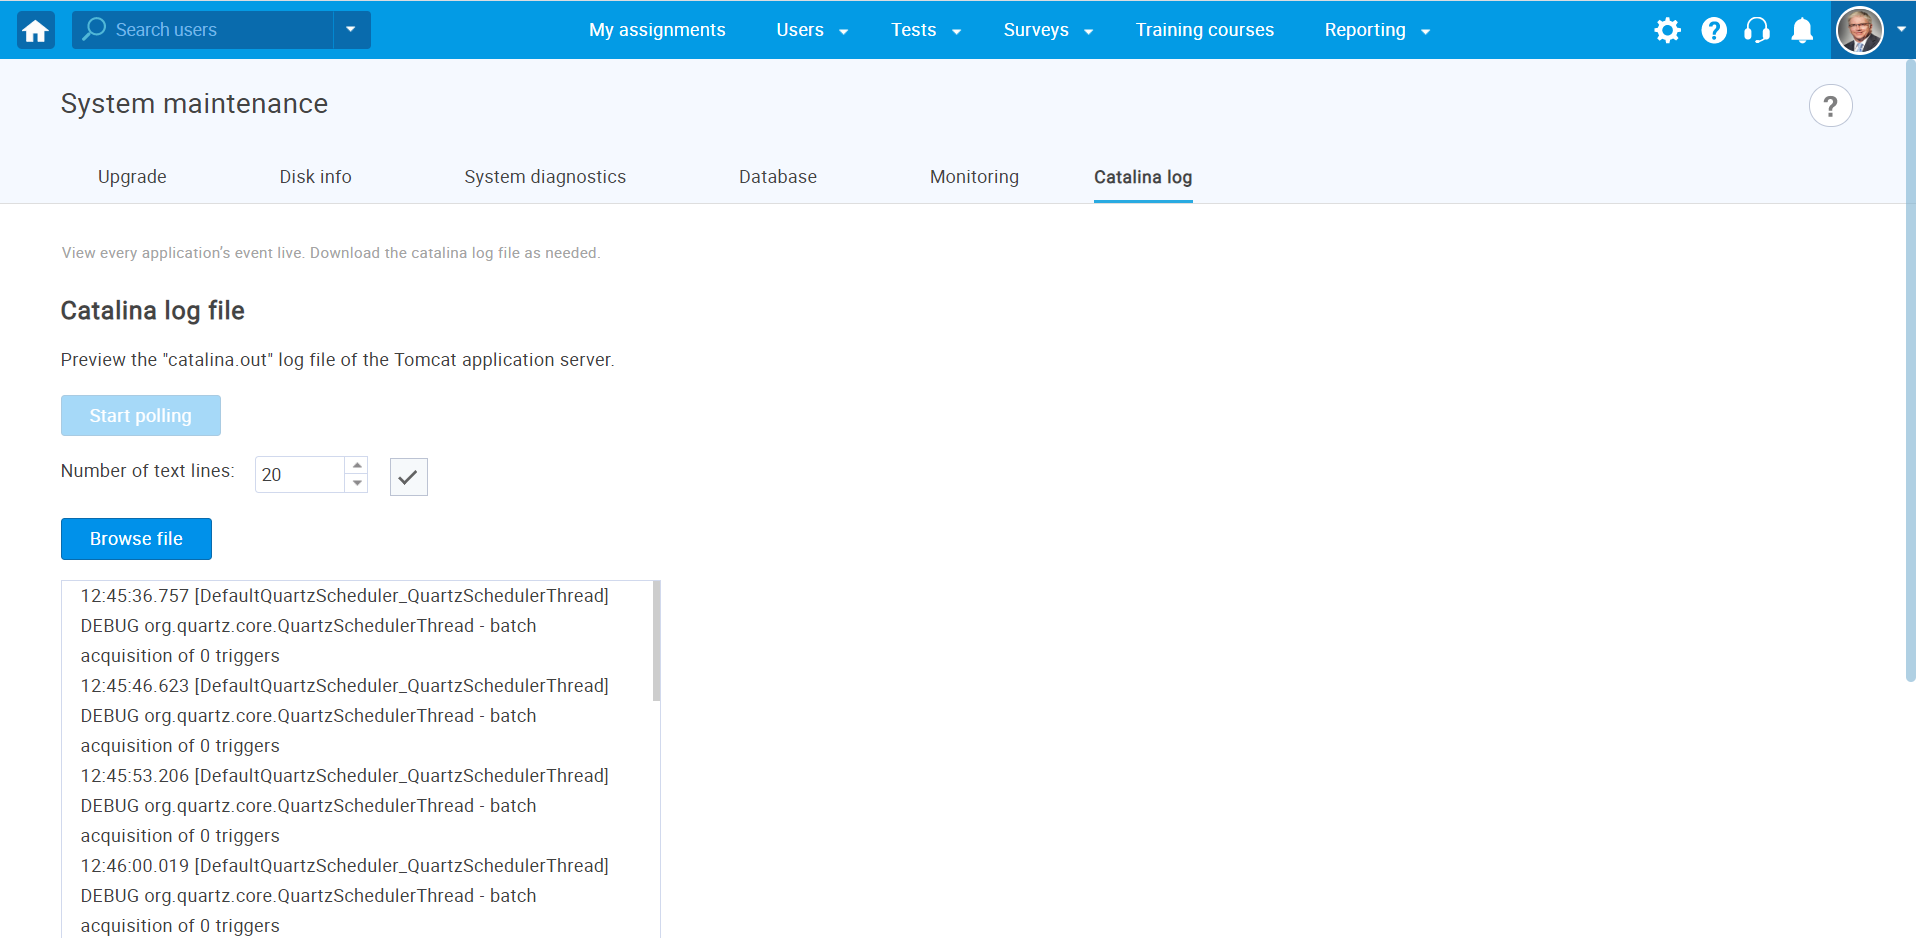
Log
View a list of Tomcat logs organized by dates. Download the log file to conduct a more detailed analysis.
The application's log file is saved in two formats. The .log file contains the complete log from deployment onwards, while .log.gz files store daily logs. Each .log.gz file has a maximum size of 50MB; if the daily log exceeds this size, multiple .log.gz files will be created.